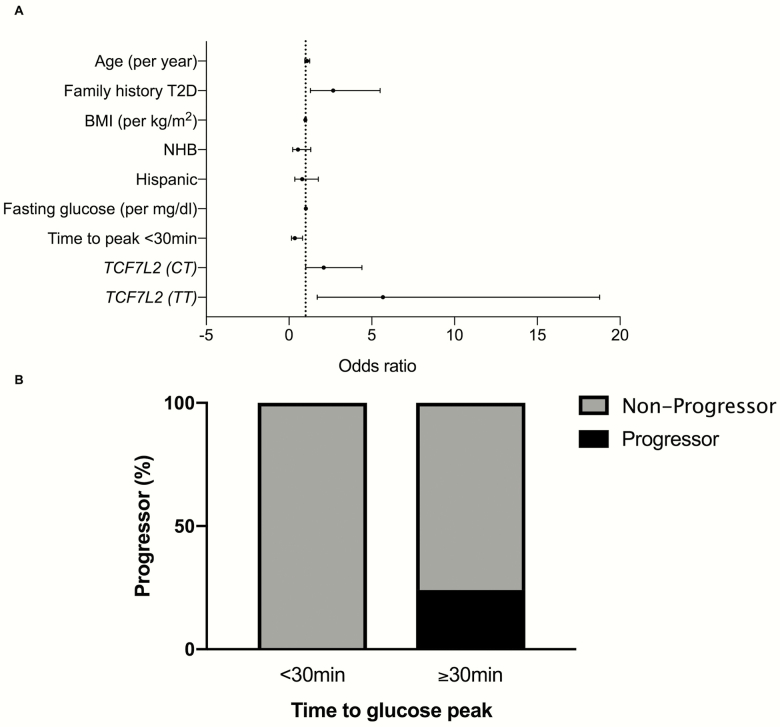
Figure 5.
(A) Odds ratio for change in glucose tolerance, defined as change from NGT to IGT, or IGT > IGT or IGT > T2D. Data are expressed as median odds and 95% confidence intervals of the estimates. (B) Percentage of “progressor” from the longitudinal cohort (n = 241). Progressor are defined as NGT > IGT or IGT > IGT or IGT > T2D. Abbreviations: BMI, body mass index; IGT, impaired glucose tolerance; NGT, normal glucose tolerance; NHB, non-Hispanic black; T2D, type 2 diabetes.

