. 2019 Sep 3;10(42):9829–9835. doi: 10.1039/c9sc03248g

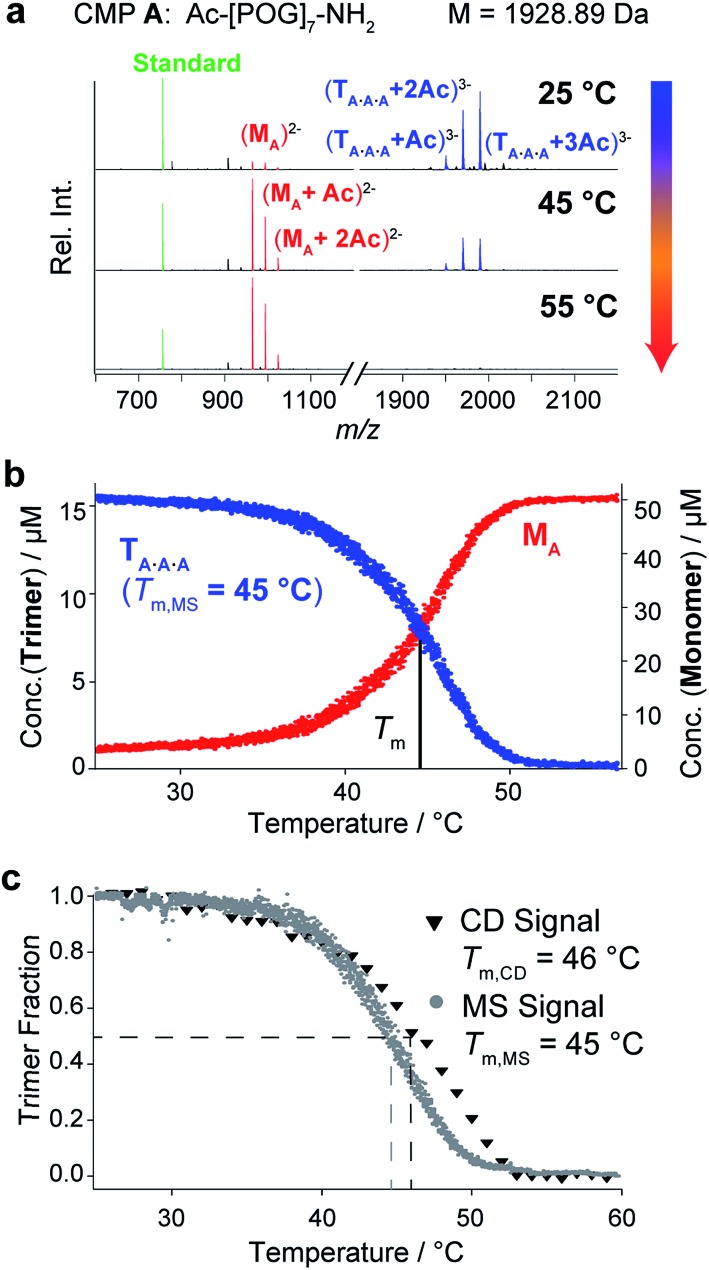
Fig. 2. CD spectroscopic and native MS analyses of CMP A (50 μM in 10 mM aq. NH4Ac at pH 7). (a) MS spectra of CMP A at different temperatures. The observed m/z signals correspond to the triply charged trimers (blue), the doubly charged monomers (red), and the internal standard (10 μM bradykinin 1–7, green). (b) Thermal denaturation profile of CMP A obtained by monitoring the monomer and trimer m/z signals as a function of temperature (heating rate: 1 °C min–1). (c) Overlay of the normalized thermal denaturation curves of CMP A obtained by using CD spectroscopy (triangles) and MS (dots) as monitoring tools (heating rate: 1 °C min–1).

Fig. 2