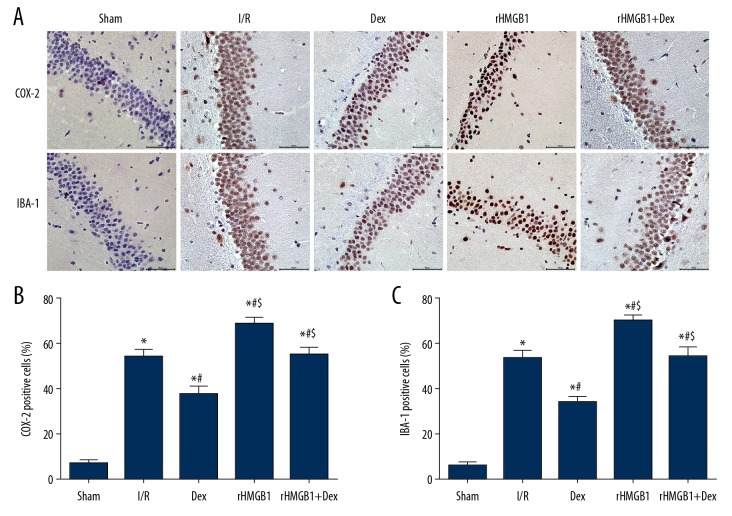
Figure 4.
Immunohistochemistry of COX-2 and IBA-1 positive cells in hippocampal CA1 region of rats (×400). (A) Immunohistochemical images; (B) Percentage of COX-2 positive cells (%); (C) Percentage of IBA-1 positive cells (%).Compared with Sham group, * P<0.05; compared with I/R group, # P<0.05; compared with Dex group, $ P<0.05.

