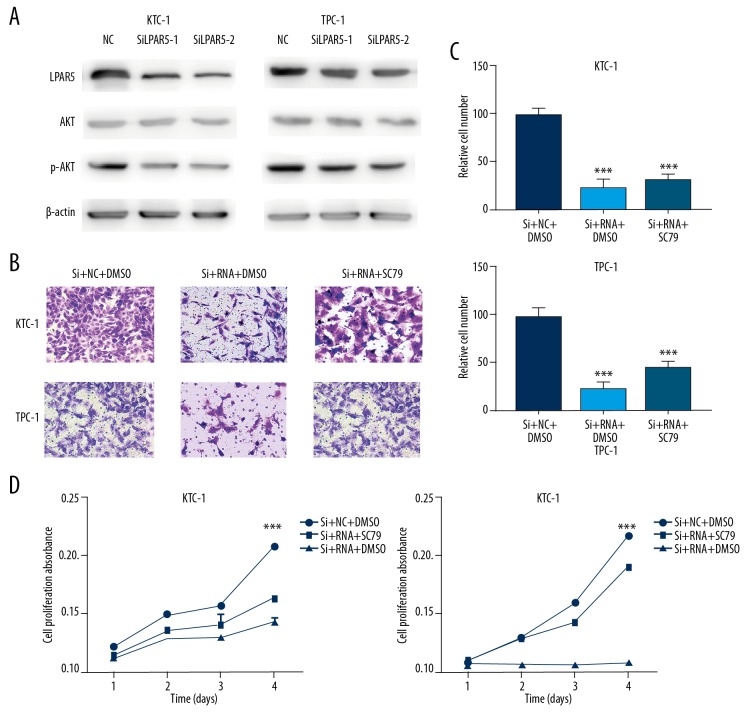
Figure 5.
Correlation between LPAR5 and PI3K/AKT pathways. (A) Effect of LPAR5 expression on LPAR5, AKT, and p-AKT levels in KTC-1 and TPC-1 (transfected with SiLPAR5-1,2 or NC). (B, C) Migration assay of NC, KTC-1, and TPC-1 cells, which were controlled with siRNA/siRNA+SC79. (D) Cell proliferation assay of NC, KTC-1, and TPC-1 cells, which were controlled with siRNA/siRNA+SC79. CCK-8 was used to measure cell proliferation.

