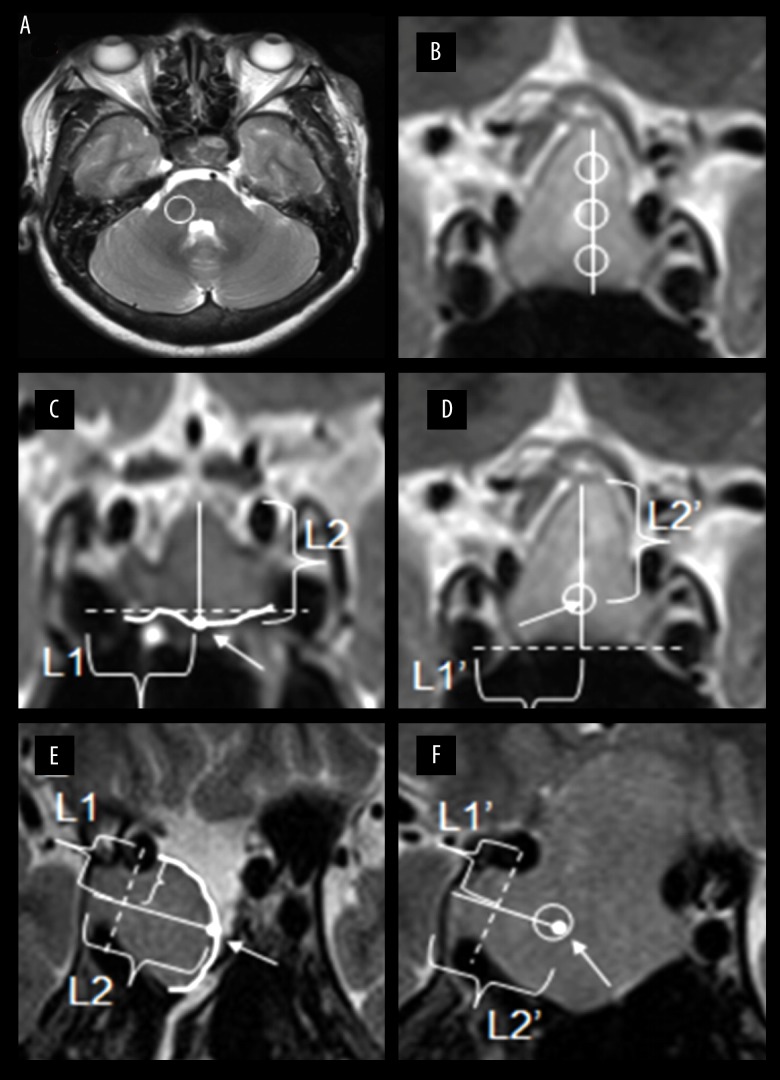
Figure 1.
Schematic diagrams for 2 cases in different residual forms. (A) ROI in the cerebellar peduncle was drawn on axial T2-weighted image. (B) The solid line represents the maximum length of tumor. Three points divided the solid line into 4 equal parts. Based on the points, tumor ROIs in 3 regions were selected on coronal T2-weighted image. (C, D) Case 1 shows the residual tumor mainly in the upper part. A dotted line was made connecting the central points of the cavernous segment of internal carotid artery on both sides. The white dot was the midpoint of the curve which represented incisal margin (white arrow). The distance between the incisal margin and the opposite margin based on white dot perpendicular to the dotted line was drawn and named L2. The length from the intersection of 2 lines to the central point of right internal carotid artery was drawn and named L1. According to line L1’ and line L2’, which was equal to line L1 and line L2, the point we found on preoperative MR was equal to that which was drawn on postoperative MR both in length and location (white arrow). ROI for the residual point was selected on the preoperative T2-weighted image. (E, F) Case 2 shows the residual tumor mainly in the invasive part of cavernous sinus segment of internal carotid artery. A dotted line was made connecting the central points of the 2 segments of internal carotid artery on the right side. The white dot was the midpoint of the curve which represented incisal margin (white arrow). The diameter of the residual adenoma based on white dot perpendicular to the dotted line was drawn and named L2. The length from the intersection of 2 lines to the central point of right internal carotid artery was drawn and named L1. According to line L1’ and line L2’, which was equal to line L1 and line L2, the point we found on preoperative MR was equal to that which was drawn on postoperative MR both in length and location (white arrow). The ROI for the residual point was selected on the preoperative T2-weighted image.

