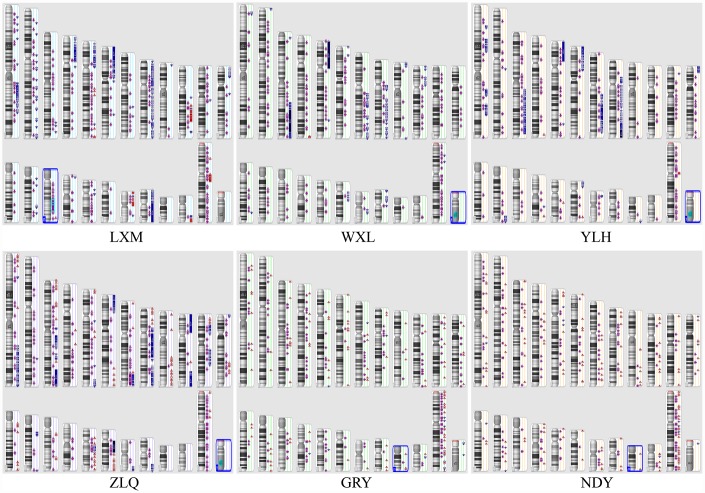
Figure 1.
Illustration of the copy number state of all samples. Chromosomes 1 through 12 are shown in the upper panel (from left to right), chromosomes 13 through 22 are shown in the lower panel, and chromosomes X and Y are shown in the lower right panel. Six samples were included (LXM, WXL, YLH, and ZLQ: OC; and GRY and NDY: normal epithelial OC). Colour indicates copy number status (blue, duplication; red, deletion; purple, LOH); greater colour saturation indicates greater CNV.

