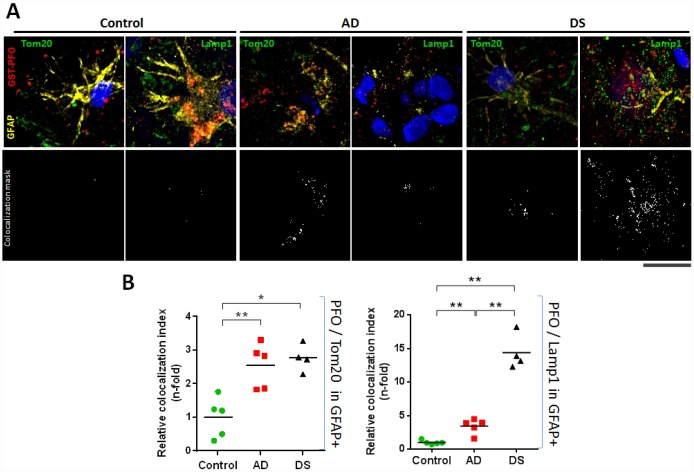
Figure 5.
Lysosomal and mitochondrial cholesterol homeostasis in hippocampal astrocytes. (A) Representative confocal representative images of 4 μm thin-stacked cryopreserved hippocampus from AD (n=5), DS (n=4), and control (n=5) subjects immunolabeled with GST-PFO (red), GFAP (yellow), and Tom20 or Lamp1 (both green). Nuclei are stained with Dapi (blue). Lower panels show colocalization mask (white) between GST-PFO and Tom20 or Lamp1, respectively, highlighted in the squared areas. Scale bar: 10 μm. (B) Cholesterol (PFO+) colocalization with mitochondria (Tom20+) or lysosome (Lamp1+) into hippocampal astrocytes (GFAP+) from AD, DS, and control donors. 10 images per sample were analysed with Image J to assess the index of astrocytic cholesterol colocalization with Tom20 or Lamp1. Values are relativized with control to show differences as n-fold. (*) p<0.05; (**) p<0.01.

