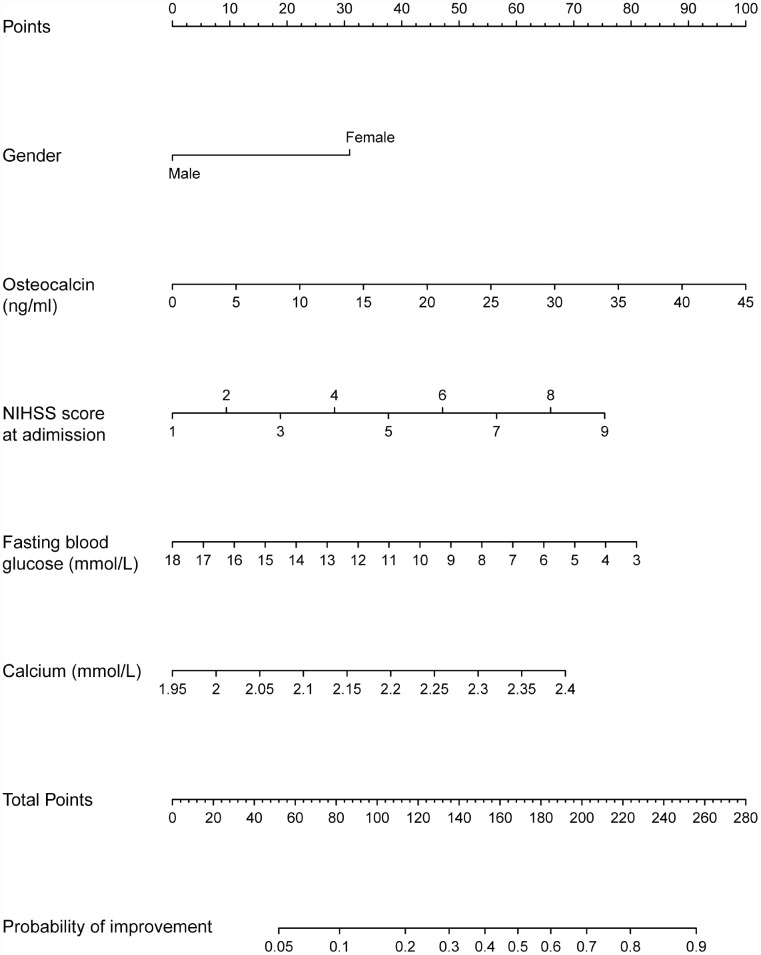
Figure 2.
Nomogram for the probability of NIHSS score improvement. Instruction for users: locate a patient’s selected variable on the corresponding axis to determine how many points the patient receives for this variable. Add the points awarded for every variable and locate this sum on the total points axis. Draw a line straight down to the Probability of improvement axis to determine the intersection point, which identifies the patient’s probability of NIHSS score improvement.

