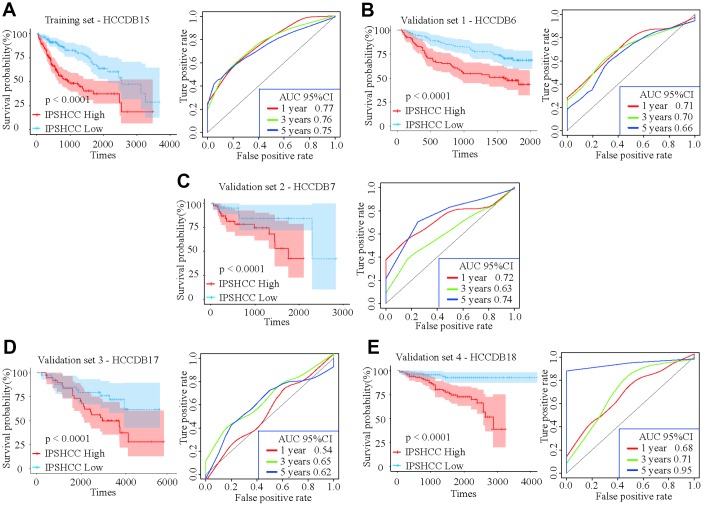
Figure 2.
Kaplan-Meier survival analyses of IPSHCC. Patients in all five datasets were assigned to low-immune (blue) and high-immune (red) risk groups using median IPSHCC value as the cutoff. (A) In the training set, the survival probability of the “IPSHCC Low” group is higher than the “IPSHCC High” group (p < 0.0001). The 1, 3, and 5 year AUCs were 0.77, 0.76, and 0.75, respectively. (B–E) The IPSHCC prognostic signature was further validated in four independent validation sets. In each independent validation subset, survival probabilities were higher for the “IPSHCC Low” group than the “IPSHCC High” group (p < 0.0001). In validation sets 1 and 4, the 1-, 3-, and 5-year AUCs were > 0.65. In validation set 2, the 1-, 3-, and 5-year AUCs were 0.72, 0.63, and 0.74, respectively. In validation set 3, the 1-, 3-, and 5-year AUCs were ≤ 0.65.

