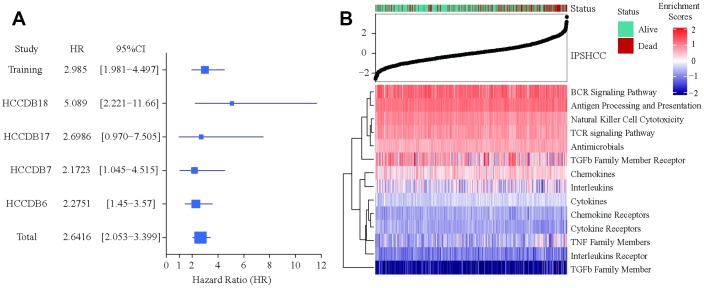
Figure 3.
Verification of IPSHCC. (A) Meta-analysis of IPSHCC and overall survival in the five datasets. In the IPSHCC training set, the hazard ratio [HR] was 2.985 and the 95% confidence interval (CI) was 1.981-4.497 (p = 1.69 × 10⁻⁶). In the four verification sets, the HRs were between 2.1723 [95% CI: 1.045–4.515; p = 0.0377] and 5.089 [95% CI: 2.221–11.66; p = 0.0001]. In the integrated analysis of all datasets, the survival probability for the high immunity risk group was 2.6416 times lower than that of the low immunity risk group (HR = 2.6416; 95% CI: 2.053–3.399; p = 4.34 × 10⁻¹⁴). (B) IPSHCC distribution with survival status in the combined dataset. Upper half of panel: IPSOV distribution with patient survival status. The X axis is sorted by IPSHCC values. Red color indicates deceased patients, while green indicates living patients. Lower half of panel: Heatmap showing enrichment scores for the corresponding 15 immune categories.

