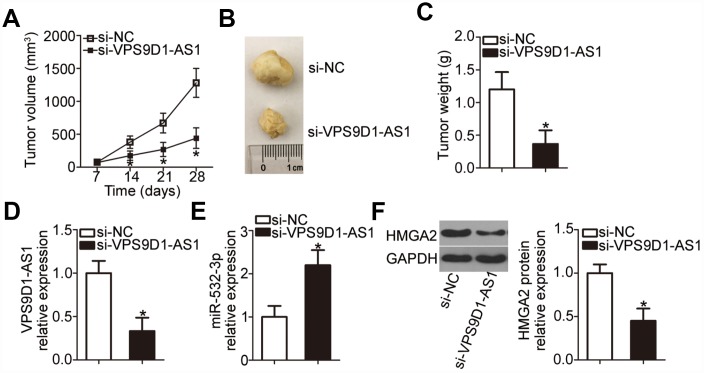
Figure 8.
VPS9D1-AS1 knockdown suppresses tumor growth of NSCLC cells in vivo. (A) Nude mice were inoculated with H460 cells transfected with si-VPS9D1-AS1 or si-NC. Tumor volumes were measured 4 weeks after the injection, and tumor growth curves were plotted. *P < 0.05 vs. the si-NC group. (B) Representative images of tumor xenografts in the two groups. (C) Weights of tumor xenografts collected at the end of the experiment. *P < 0.05 vs. the si-NC group. (D, E) RT-qPCR analysis of VPS9D1-AS1 and miR-532-3p expression levels in tumor xenografts from si-VPS9D1-AS1 and si-NC groups. *P < 0.05 vs. the si-NC group. (F) Western blot data illustrating the HMGA2 protein expression level in the tumor xenografts derived from H460 cells transfected with si-VPS9D1-AS1 or si-NC. *P < 0.05 vs. the si-NC group.

