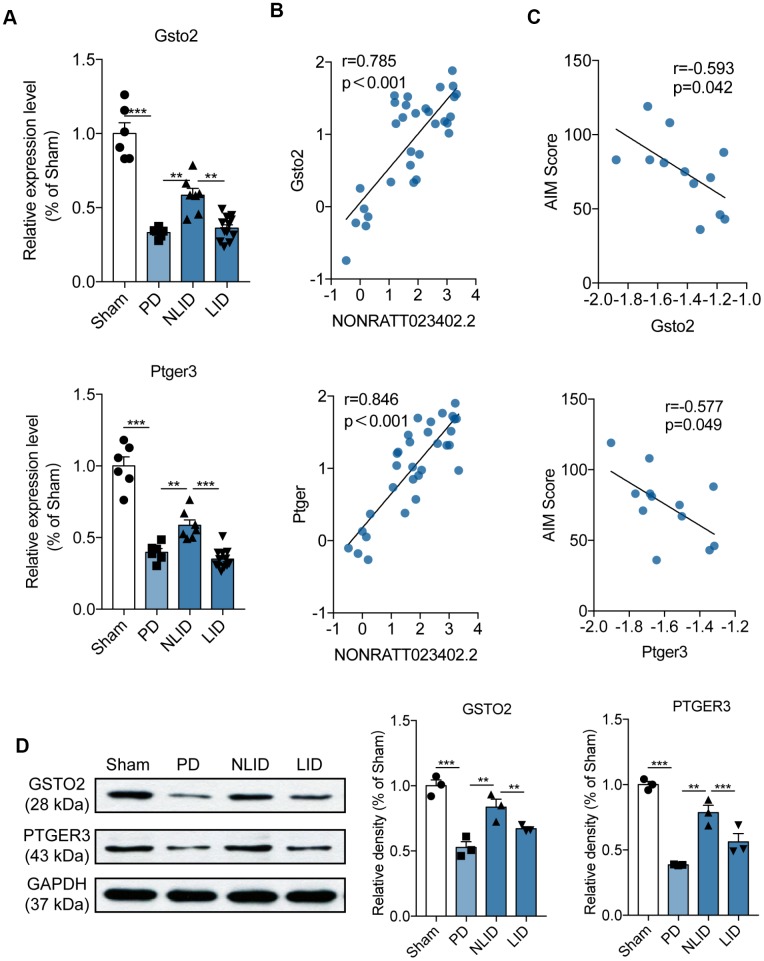
Figure 4.
Expression profiles of the potential target genes of lncRNA NONRATT023402.2. (A) Gsto2 and Ptger3 expression determined by qRT-PCR in the striatum of PD and LID rats and their corresponding controls (n = 6–11). (B) Correlation between NONRATT023402.2 and Gsto2 or Ptger3 expression levels in the striatum of PD and LID rats and their corresponding controls (n = 11). (C) Correlation between Gsto2 or Ptger3 expression in the striatum of LID rats and AIM score (n = 11). (D). GSTO2 and PTGER3 protein levels in the striatum of PD and LID rats and their corresponding controls (n = 3), as determined by western blotting. The intensity of protein bands was quantified by densitometry and normalized to that of GAPDH. Data represent mean ± SEM. **P < 0.01, ***P < 0.001.

