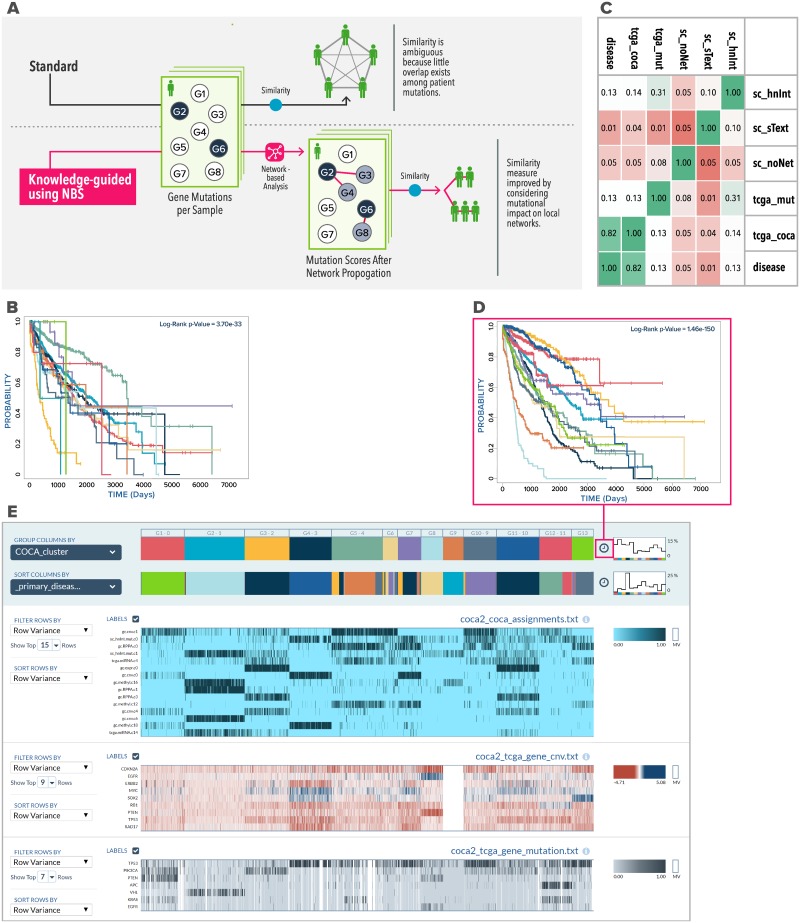
Fig 3. Knowledge-guided sample clustering.
(A) Knowledge-guided sample clustering, illustrated in the context of somatic mutation profiles of cancer patients. Because mutations are rare, 2 patients may not have mutations to the same gene(s), and their mutual similarity will be modest. In the knowledge-guided mode (bottom), similarities between patient profiles are detected if not only the same genes are mutated but also if genes located proximally on a network are mutated; this “relaxed” notion of mutation profile similarity leads to improved clustering. (B) Kaplan-Meier survival analysis of clusters from HumanNet-guided clustering of somatic mutation profiles. Each of 14 reported clusters is plotted as a separate survival curve, and the p-value of the multivariate log-rank test is displayed. (C) Concordance between different clustering approaches, using ARI. Three of these approaches use the Sample Clustering (sc) pipeline, with HumanNet (hnNet), STRING text mining (sText) or no network (noNet) for guidance. Two clustering approaches are reproductions from the Hoadley and colleagues (“tcga_mut” obtained from mutation data and “tcga_coca” obtained from multiomics data using COCA). The sixth clustering (disease) is simply a grouping of patients by tumor type. (D) Kaplan-Meier survival analysis of 13 COCA clusters in pan-cancer multiomics data. Users may click the clock icon next to cluster assignments in the Spreadsheet Visualizer to access this display, which uses the current grouping criterion (configurable) for survival analysis. (E) Sample Clustering of pan-cancer multiomics profiles, displayed by the Spreadsheet Visualizer module. Patient profiles are grouped by overall cluster assignment using COCA. The top heat map (blue) shows cluster assignments based on individual omics data types (expr, expression; RPPA, proteomic; CNV, copy number variation; methyl, methylation; miRNA, microRNA). The heat maps below show CNV data for select genes (middle) and mutation data for select genes (bottom) for the same patients. Users can configure the number of rows to display for each data source, the statistical criteria for selecting rows, and their sorting order. The grouping criteria for samples (COCA cluster assignments here) can also be configured. User-selected clinical annotations of patients (primary disease in this view; color bar second from top) may also be displayed. ARI, adjusted rand index; CNV, copy number variation; COCA,cluster of cluster assignment; NBS, network-based stratification; STRING, search tool for recurring instances of neighboring genes.

