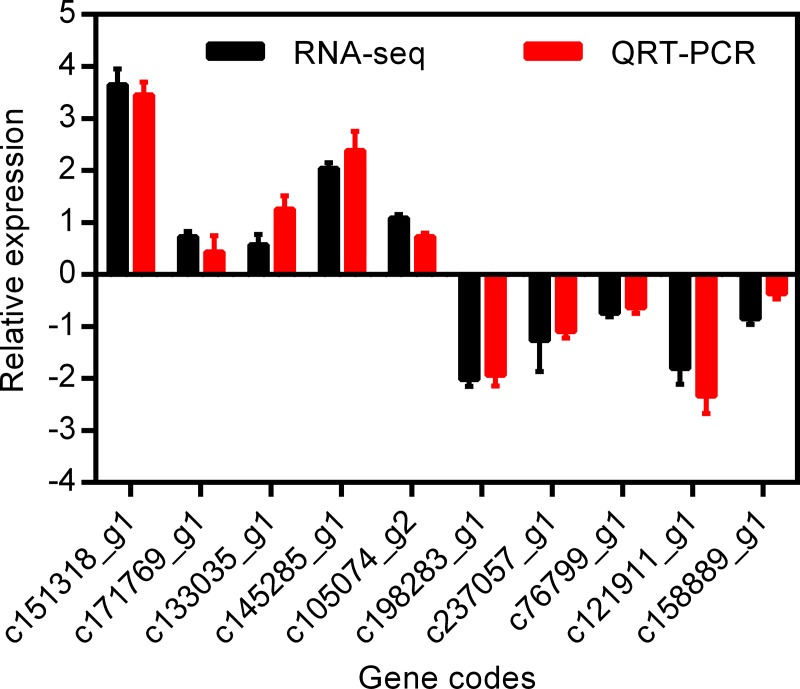
Fig 6. Validation of DEGs data by RT-qPCR.
The relative expression levels of the selected genes were normalized to the expression level of the actin gene. The black bars and red bars represent relative expression level of LT to CK with RNA-seq and RT-qPCR methods, respectively. CK: control (20°C); LT: low temperature (4°C).

