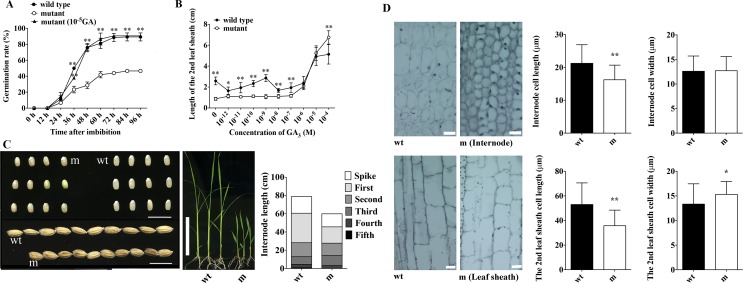
Fig 1. Phenotypic characterization of the mutant.
(A) Comparison of seed germination among wild-type, mutant, and mutant treated with 10−5 M GA3. (B) Elongation of the second leaf sheath of mutant and wild-type rice in responding to gradient concentration of GAs. (C) Morphological phenotypes of mutant in comparison with wild type. Left and middle panels show the seed size and seedlings, respectively; and the right panel shows the comparison of different internodes. Data are means from n≥25 plants. Scale bars = 1 cm. (D) Microscope images (left panels) and quantitative analysis (right panels) of the second internode (upside panels) and leaf sheath (bottom panels) cell length. “m” stands for the mutant, and “wt” stands for the wild type. Data are means±SE from at least 4 plant sections with at least 6 cells in each section. Significant difference was determined by Student’s t-test (*p < 0.05, **p < 0.01). Scale bars = 10 μm.

