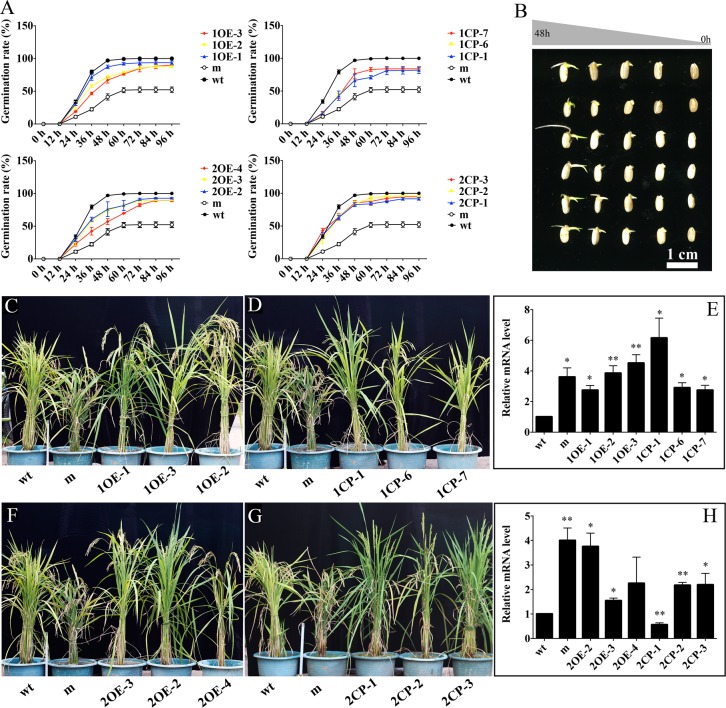
Fig 3. Genetic complementation analyses of the mutant.
(A) Germination assay of wild type, mutant, and different transgenic lines. Upside and downside panels are the data for the overexpression (left) and native promoter lines (right) of OsKO1 and OsKO2, respectively. (B) Images showing the germinating seeds from 0 to 48 h of different rice lines. (C) Rescue of the mutant phenotype in OsKO1overexpression lines. (D) Rescue of the mutant phenotype in OsKO1 transgenic lines driven by its native promoter. (E) Expression of OsKO1 gene in different rice lines. (F) Rescue of the mutant phenotype in OsKO2 overexpression lines. (G) Rescue of the mutant phenotype in OsKO2 transgenic lines driven by OsKO1 native promoter. (H) Expression of OsKO2 gene in different rice lines. “wt”, wild-type; m, mutant; 1OE-1,2,3, OsKO1 gene overexpression transgenic lines; 1CP-1,6,7, OsKO1 gene native promoter transgenic lines; 2OE-2,3,4, OsKO2 gene overexpression transgenic lines; 2CP-1,2,3, OsKO2 gene native promoter transgenic lines. Rice OsActin1 was used as internal reference for the qRT-PCR analysis. Data are means±SE (n≥3). Significant difference was determined by Student’s t-test (*p < 0.05, **p < 0.01).

