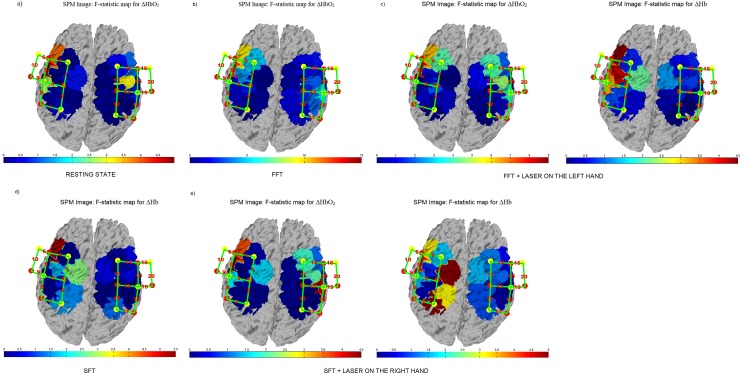
Fig 5. F-statistic values of ΔHbO2 and ΔHb during different conditions.
FM and Control groups activation maps using canonical HRF model. The higher difference between control subjects and patients’ activations is represented with the red colour. (a) F-statistic values of ΔHbO2 during the resting state condition; (b) F-statistic values of ΔHbO2 during the FFT condition; (c) F-statistic values of ΔHbO2 and ΔHb during the FFT + LASER ON THE LEFT-HAND condition; (d) F-statistic values of ΔHb during the SFT condition; (e) F-statistic values of ΔHbO2 and ΔHb during the SFT + LASER ON THE RIGHT-HAND condition.

