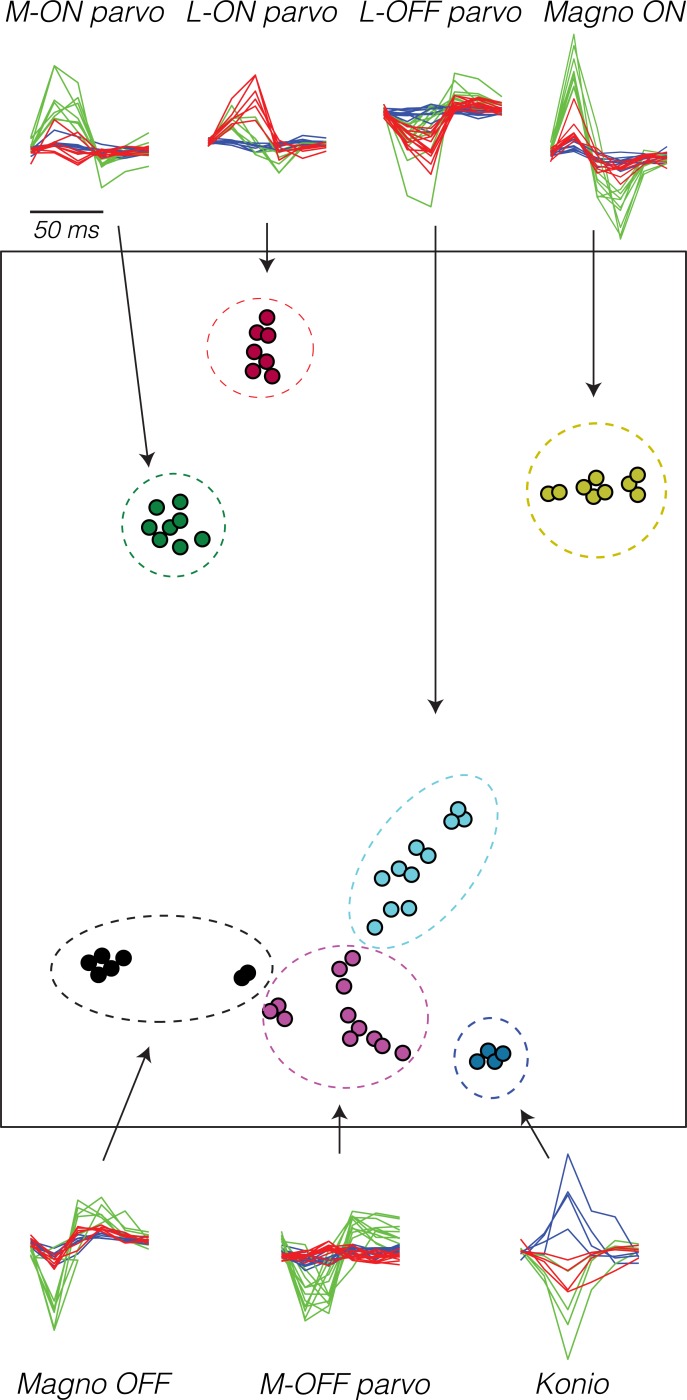
Fig 1. t-SNE of STAs from 58 LGN neurons [39].
Pixels in the white-noise stimulus that impinged on the RF were averaged to derive a 6 (frames) × 3 (color) temporal–chromatic STA for each neuron. STAs are plotted around the perimeter, and similar STAs have been superimposed. Arrows indicate the correspondence between STAs in time–color and t-SNE representations, which have been manually partitioned into seven clusters (dashed ellipses). Singular value decomposition was used to represent each STA as a 9-element vector prior to t-SNE. The singular value decomposition preserved an average of 78% of the variance in the STAs across neurons (SD = 10%). The axes of the t-SNE plot are arbitrary; only distances between points are meaningful. Data are available at https://github.com/horwitzlab/LGN-temporal-contrast-sensitivity/blob/master/DataByFigure.xlsx. Konio, koniocellular; LGN, lateral geniculate nucleus; Magno, magnocellular; parvo, parvocellular; RF, receptive field; SD, standard deviation; STA, spike-triggered average; t-SNE, t-distributed stochastic neighbor embedding.

