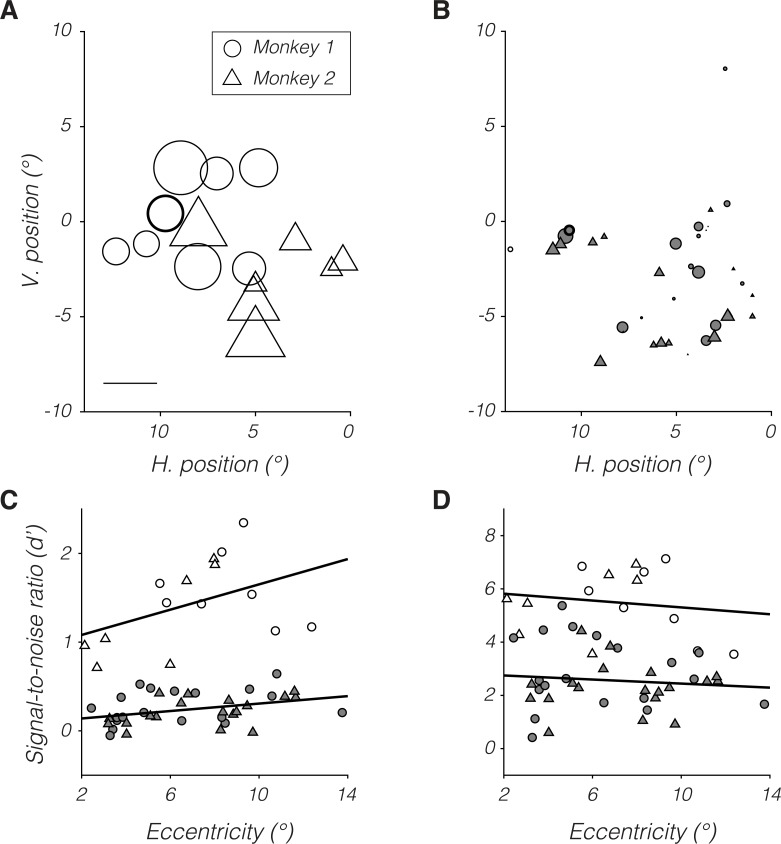
Fig 3. Dependence of d′ on RF location for monkey 1 (circles) and monkey 2 (triangles).
(A and B) Symbol position represents RF location in visual space, and symbol size represents d′ for magnocellular (A) and parvocellular neurons (B). Scale bar in (A) represents a d′ of 1 and corresponds to circle diameter and triangle base width in (A) and (B). Example neurons from Fig 2 are highlighted with bold outlines. (C) Data from (A) and (B) replotted as a function of retinal eccentricity. (D) Data from (C) multiplied by population scale factors. Open and filled symbols in (C) and (D) represent data from magnocellular and parvocellular neurons, respectively. Symbol size in (C) and (D) is not meaningful. Data are available at https://github.com/horwitzlab/LGN-temporal-contrast-sensitivity/blob/master/DataByFigure.xlsx. H., horizontal; RF, receptive field; V. vertical.

