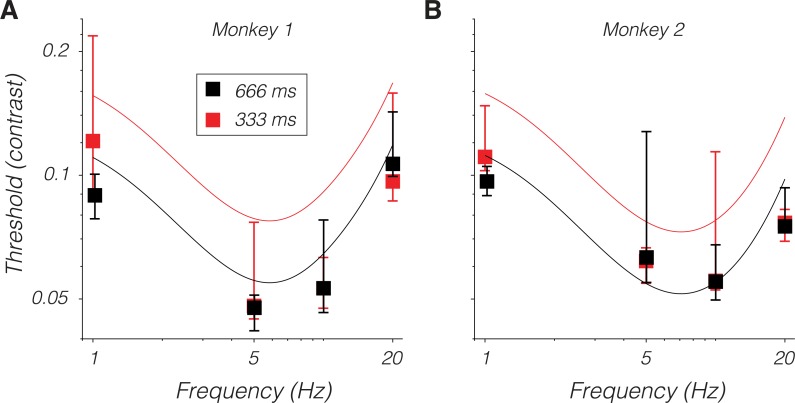
Fig 7.
Behavioral detection thresholds from monkey 1 (A) and monkey 2 (B) for stimulus presentations lasting 666 ms (black) and 333 ms (red). Symbols are medians, and error bars span 25th to 75th percentiles. Black curves are predicted thresholds from the model in [27], which is based on a 666-ms presentation time. The red curve is identical to the black curve but shifted up by to represent the threshold expected under perfect integration given a 333-ms stimulus duration. Stimuli in these experiments were presented at 5° on the horizontal meridian. Data are available at https://github.com/horwitzlab/LGN-temporal-contrast-sensitivity/blob/master/DataByFigure.xlsx.

