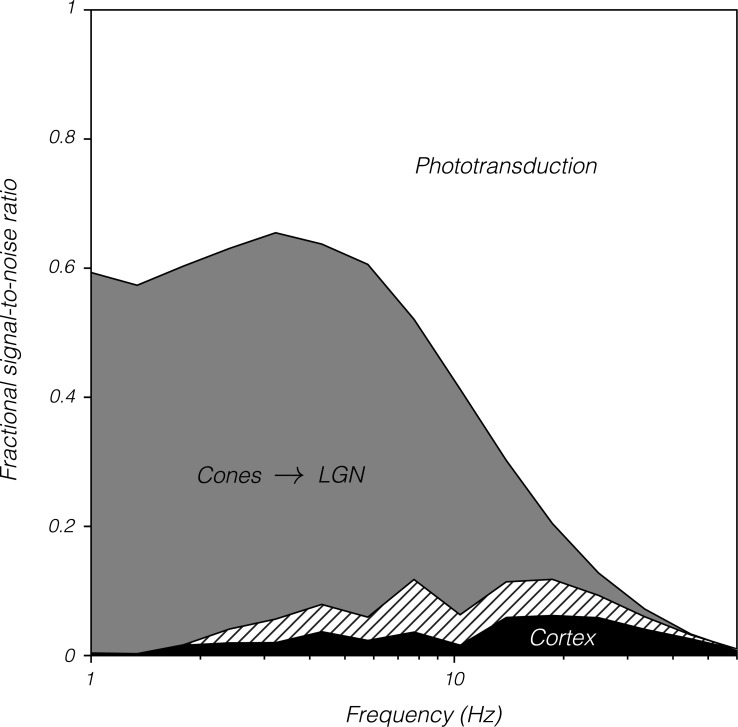
Fig 9. Fractional signal-to-noise ratio as a function of temporal frequency and stage of the visual system.
Data are identical to those shown in Fig 5 but have been shifted and scaled so that d′ of the photon absorption ideal observer is 1 and behavioral d′ is 0. Filled-in regions represent signal-to-noise loss between pairs of consecutive stages: from photon absorption to cone currents (white), from cone currents to LGN spikes (gray), and from LGN spikes to behavior (black). Data were averaged across monkeys and across magnocellular and parvocellular populations. Parvocellular neurons were omitted below 1.5 Hz because including them reduced the d′ of LGN populations below the theoretical floor of 1.27. Eliminating parvocellular neurons entirely increased d′ of LGN populations across temporal frequencies (cross-hatched area). Data are available at https://github.com/horwitzlab/LGN-temporal-contrast-sensitivity/blob/master/DataByFigure.xlsx. LGN, lateral geniculate nucleus.

