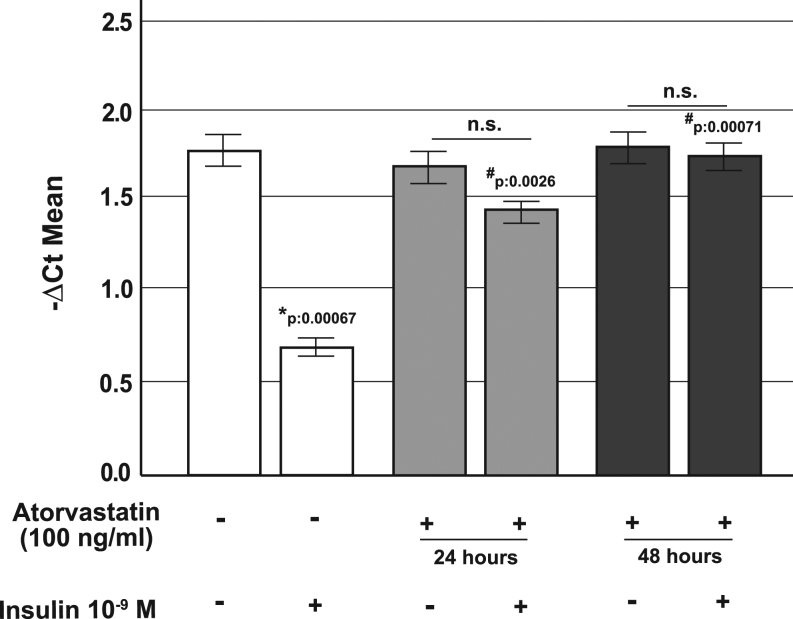
Figure 4.
Effect of atorvastatin on proglucagon gene expression in α-TC1 cells. Real-time analysis for proglucagon gene expression in control cells and in cells pre-exposed to atorvastatin (100 ng/mL for 24 or 48 h) and/or insulin (10−9 M for 24 h). *P < 0.05, vs control in absence of insulin stimulation; #P < 0.05 vs insulin stimulated control; n.s. not significant (1-way ANOVA followed by Bonferroni test, n = 3). Data are expressed as ∆Ct multiplied by −1.

 This work is licensed under a