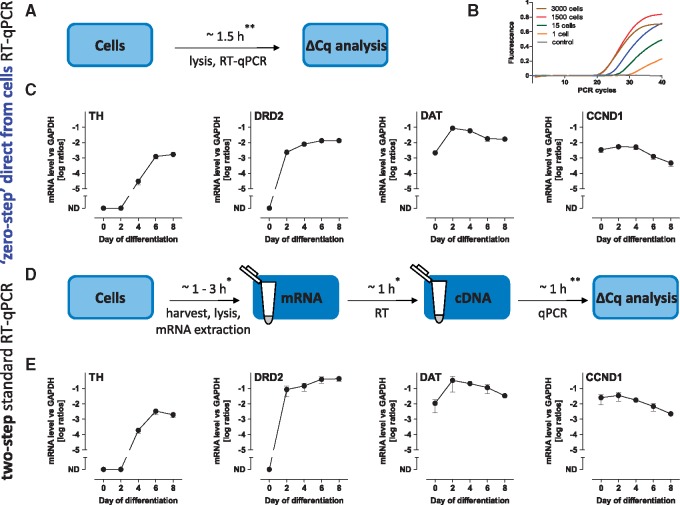
Figure 2.
Comparison of neuronal marker expression via ‘zero-step’ direct-from-cells and two-step RT-qPCR methods. (A) Experimental setup of the ‘zero-step’ direct-from-cells RT-qPCR without RNA extraction and without separate isothermal reverse-transcription steps. (B) Amplification curves of GAPDH gene from a dilution series samples of LUHMES cells (0–3000 cells). (C) mRNA expression levels of TH, DRD2, DAT1, and CCND1 during LUHMES differentiation (d0–d8) determined by ‘zero-step’ RT-qPCR using VolcanoCell2G Master Mix. (D) Experimental setup of a standard two-step RT-qPCR including the RNA extraction, reverse-transcription (RT), and qPCR steps. (E) mRNA expression levels of TH, DRD2, DAT1, and CCND1 during LUHMES differentiation (d0–d8) determined by two-step RT-qPCR using iScript™ Reverse Transcription Supermix and SsoFast™ EvaGreen® Supermix. Data are means ± SD of three independent LUHMES differentiations, each consisting of three technical replicates normalized to GAPDH expression (TH, tyrosine hydroxylase; DRD2, dopamine receptor D2; DAT, dopamine transporter; CCND1, cyclin D1). ND = not detectable. *, these durations were estimated based on ∼45 samples and can vary due to the method of choice for mRNA purification. **, these durations were estimated based on the preparation and run of one 96-well RT-qPCR plate.

