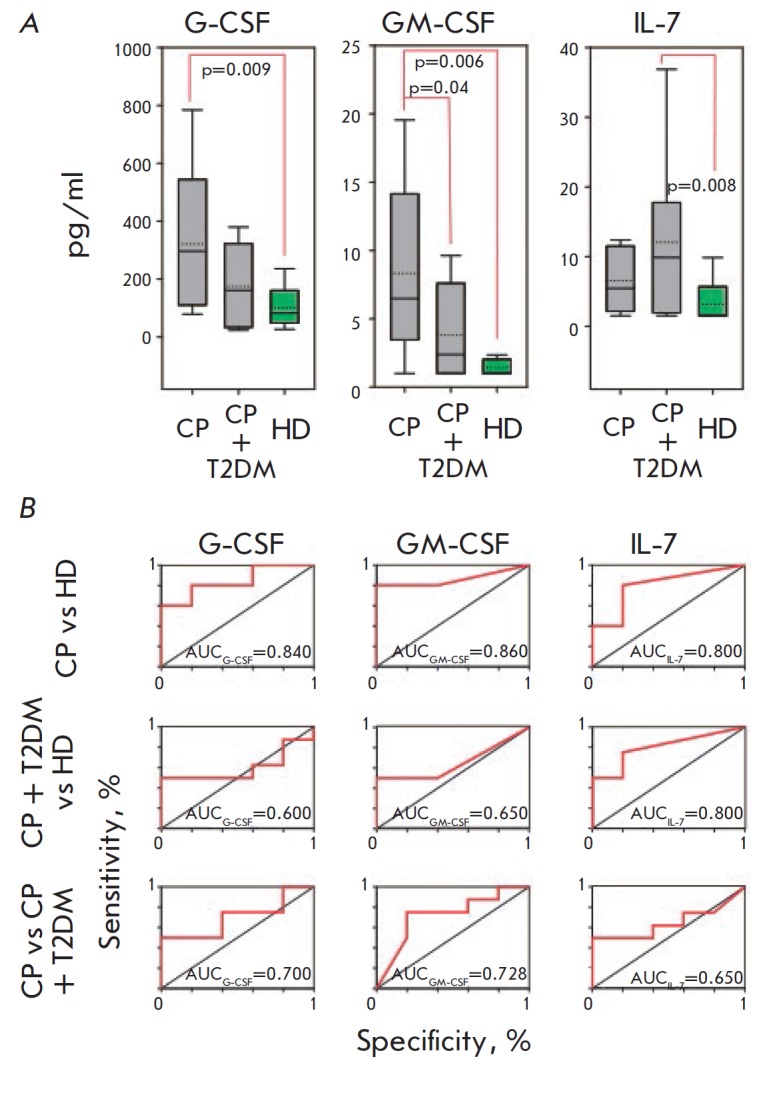
Fig. 2.

Levels of growth factors in the saliva (A) of patients with chronic periodontitis (CP), chronic periodontitis associated with type 2 diabetes (CP+T2DM) and healthy donors (HD), and the corresponding ROC-curves (B). The interquartile range is shown by boxes. The median in each group is shown by the bold line. Bars represent the 95% confidence interval. Statistically significant differences with their respective p values are indicated; AUC – area under the ROC curve
