. 2020 Jan 2;9:e46775. doi: 10.7554/eLife.46775

Figure 3. α-syn aggregates formed in the presence of inhibitors show reduced seeding ability in cells.

(A) Experimental design of cell culture seeding assay. 50 µM recombinant α-syn monomers (green) were aggregated (by agitation at 37°C for 2 days) in presence of various amounts of inhibitors (red). Then HEK293 cells expressing YFP labeled WT/A53T α-syn were transfected with α-syn aggregated in presence or absence of inhibitors. Cells were imaged after one day using fluorescence microscopy and the bright fluorescent puncta were counted using imaging cytometer. (B and D) Representative fluorescence micrographs of HEK293 cells expressing YFP-labeled WT (B) and A53T (D) α-syn transfected with aggregated α-syn in presence or absence of inhibitors. Transfection of α-syn aggregates induced endogenous α-syn to form large aggregates seen as bright puncta (white arrows). Transfection of α-syn aggregated in presence of inhibitors induced fewer puncta (white arrows) suggesting that all four inhibitors reduce the seeding ability of α-syn. Scale 100 µm. (C and E) Quantification of puncta formed in different conditions. With increasing concentrations of inhibitor, there is a decrease in number of puncta formed showing that the inhibitors decrease α-syn seeding ability in a dose-dependent manner. Results shown as Mean + SD (n = 3) of technical replicates. Statistical significance was analyzed by two-way ANOVA. (**p<0.01,***p<0.001,****p<0.0001).

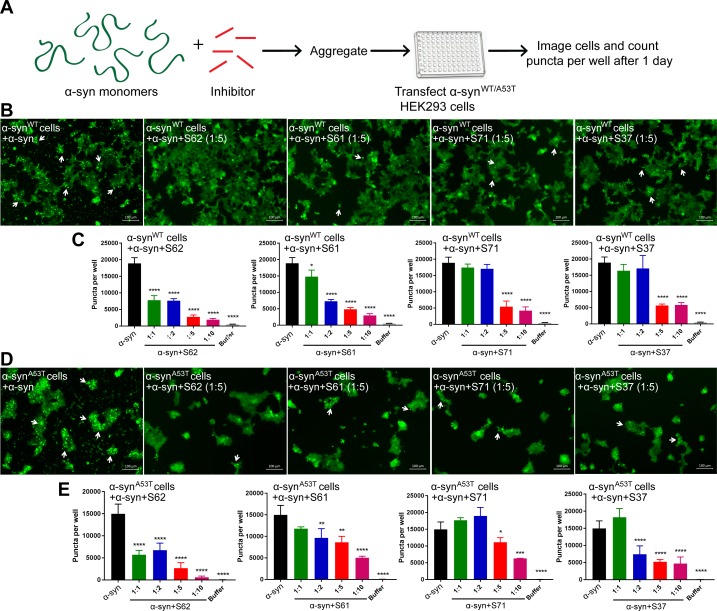
Figure 3.

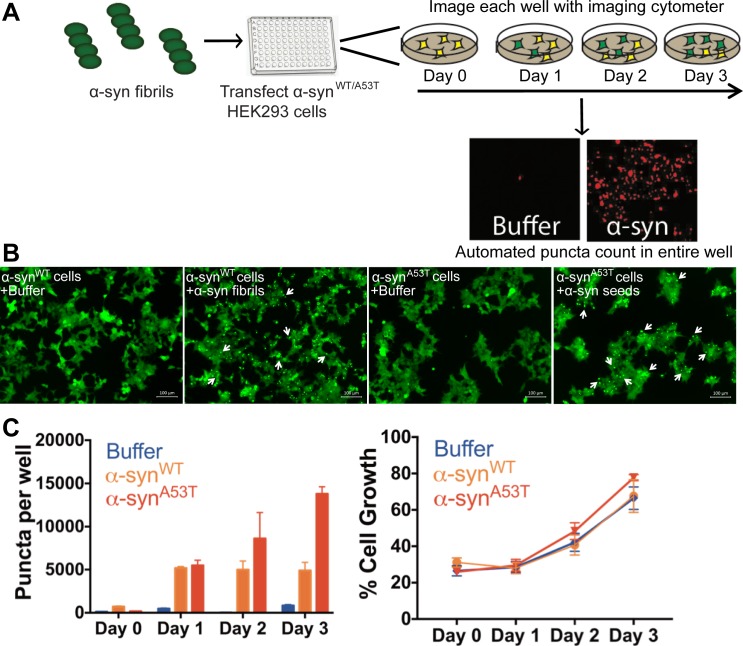
Figure 3—figure supplement 1. Cell culture seeding assay.

Figure 3—figure supplement 1.

(A) Experimental setup for high throughput screening in HEK293 cells. HEK293 cells were plated in 96 well plates. 125 nM α-syn fibrils were transfected and plates were imaged using an automated imaging cytometer. Puncta formed in each well were then counted using ImageJ particle analysis plugin allowing for unbiased measurements. (B) Fluorescence microscope images of HEK293 cells expressing YFP-labeled WT or A53T α-syn. Upon transfection of α-syn fibrils fluorescent puncta can be seen (white arrows). Scale 100 µm. (C, Left) Quantification of total puncta formed in each condition. The total number of puncta increases over time suggesting a prion-like propagation of aggregates. (C, Right) In both WT and A53T expressing HEK293 cells we do not observe cell death as seen by measuring the growth of cells transfected with buffer or α-syn fibrils.
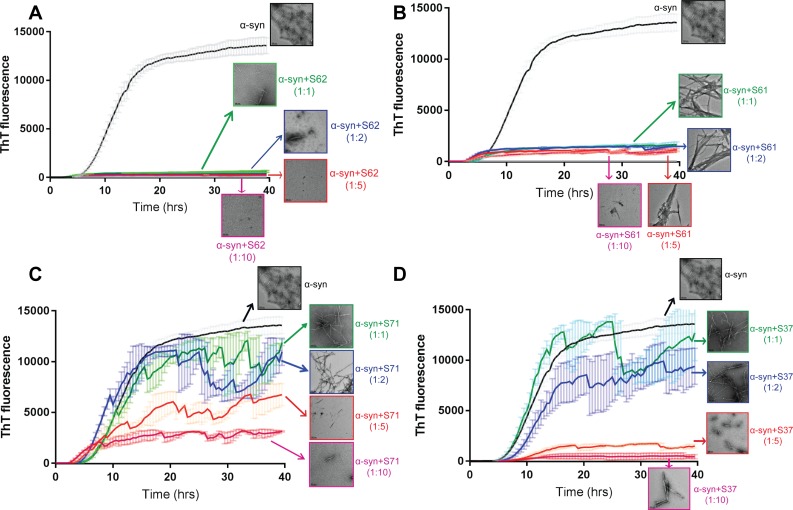
Figure 3—figure supplement 2. Inhibitors reduce α-syn aggregation in vitro in a dose-dependent manner.

Figure 3—figure supplement 2.

Monomeric α-syn was incubated with a range of concentrations of each inhibitor S62 (A), S71 (B), S71 (C) and S37 (D), α-syn:inhibitor molar ratios, 1:1, 1:2, 1:5 and 1:10. The ThT fluorescence data during incubation and electron micrographs of each sample at the end of incubation period show that with increase in concentration of each inhibitor there is decrease in ThT fluorescence and abundance of fibrils. This suggests that all four inhibitors, S62, S61, S71 and S37 have a dose-dependent inhibitory effect on α-syn aggregation kinetics. Scale bars in electron micrographs are 200 nm.