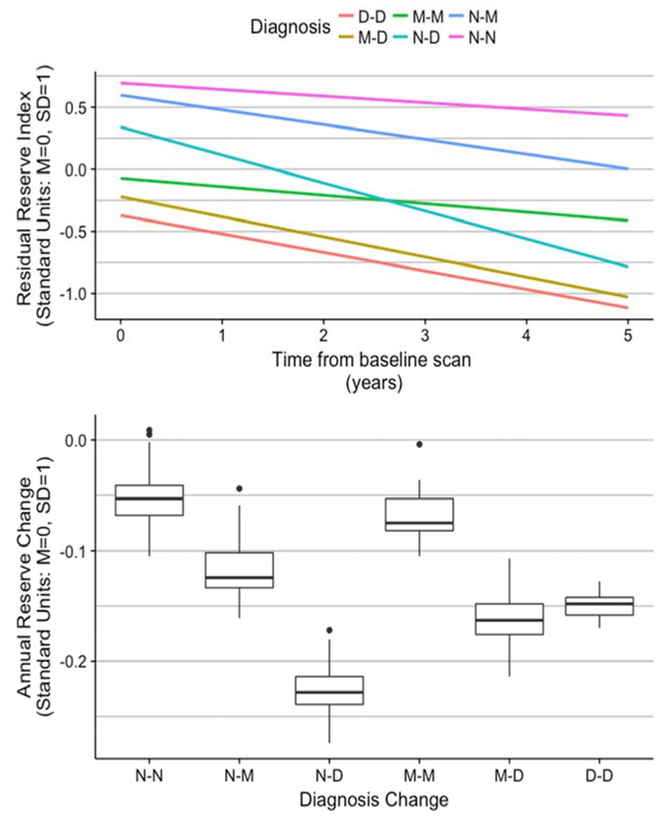
Figure 2.
Residual reserve index by diagnosis change. The upper panel shows average trajectories over time of reserve across groups defined by first and last clinical diagnosis. The lower panel shows distributions of reserve change by diagnosis change groups. Abbreviations: MCI, mild cognitive impairment; D-D, dementia at first and last assessments; M-D, MCI at first assessment, dementia at last; M-M, MCI at first and last assessments; N-N, normal at first and last assessments; N-M, normal at first and MCI at last; N-D, normal at first and dementia at last.

