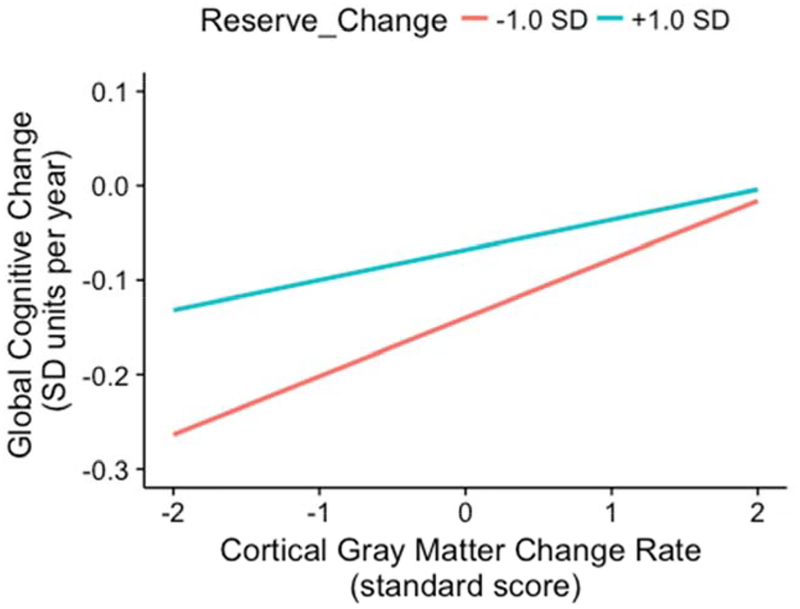
Figure 3.
Reserve Change by Cortical Gray Matter Change interaction effect on global cognitive slope. The graph shows the association between annual change in non-memory cognitive function and annual change in cortical gray matter volume as a function of reserve status. Reserve status was based on model predicted trajectories that were faster than average (−1 SD, shown in red; rapidly declining reserve status over time) or slower than average (+1 SD, shown in teal; slowly declining reserve status over time).

