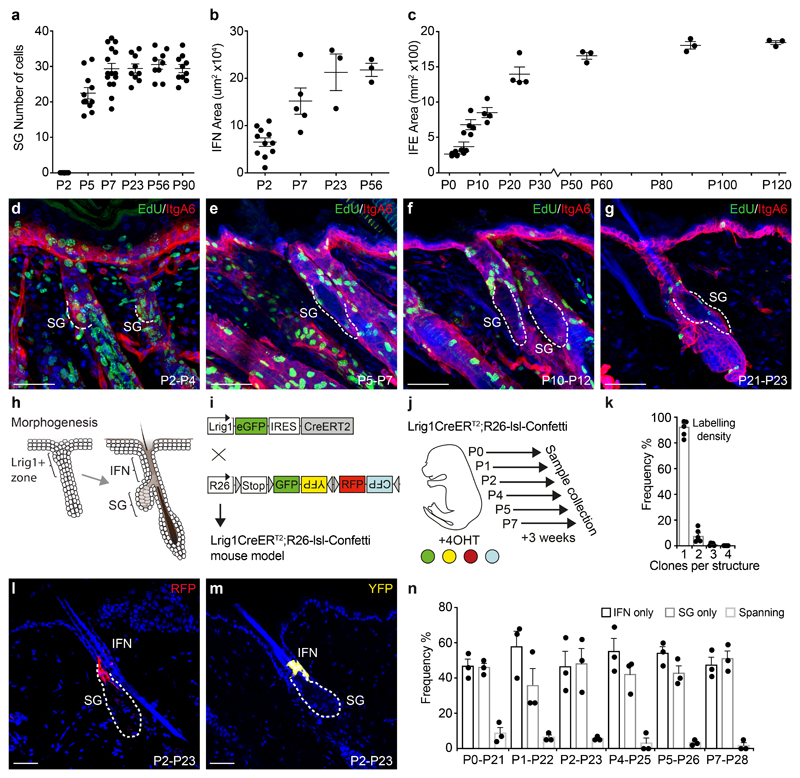
Figure 1. Epidermal morphogenesis characterised by tissue-specific growth and rapid sebaceous gland formation.
(a) Individual SG sizes (cell numbers), at P2: n=7 glands, P5: n=11, P7: n=15, P23: n=9, P56: n=9, P90: n=10. Infundibulum (IFN) area at P2: n=11 follicles, P7: n=5, P23: n=3, P56: n=3. Data pooled from 3-5 animals/time point. Interfollicular epidermis (IFE) defined as total back skin area at P2: n=4 mice, P5: n=4, P7: n=4, P12: n=4, P23: n=4, P56: n=3, P90: n=3, P120: n=3. Data are means±S.E.M. (d-g) IntegrinA6 (ItgA6, red) and EdU (green) detected in rendered confocal z-stacks of back skin. Representative images reflect 48-hour EdU pulse chase experiments from day P2, P5, P10 or P21 (h) Schematic illustration of the premature and adult hair follicle with an Lrig1+ area indicating the prospective SG and IFN. (i) Strategy for reporter induction in Lrig1+ cells. (j) Induction of different cohorts to delineate SG morphogenesis. (k) Fraction of clones found in upper hair follicle structures (IFN or SG) at P7 following 4OHT induction at P2. Data are means±S.E.M. (n=5 animals). (l, m) Typical RFP (red) and YFP (yellow) clones detected in rendered confocal z-stacks of back skin following a 3-week chase (Images representative of 3 mice). (n) Clone location within the SG, IFN or both (spanning) following a 3-week trace from P0, P1, P2, P4, P5 or P7. Data are means±S.E.M (n=3 animals/group). Demarcated lines represent the boundary between dermis and epidermis at the site of the prospective and adult SG. Nuclei are counterstained with DAPI (blue). Scale bars, 50μm.

