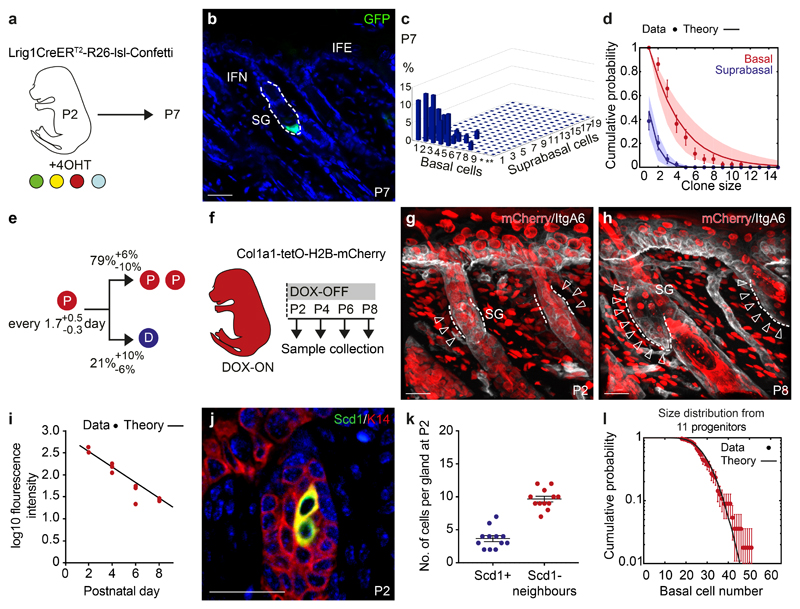
Figure 2. Lineage restriction and cellular dynamics of sebaceous gland morphogenesis.
(a) Strategy for tissue collection at P7 following 4OHT administration at P2. (b) Detection of a representative GFP (green) clone at P7 in rendered confocal z stacks. (c) Frequency of individual clones scored in 3D composed of a given number of basal cells and subrabasal cells (d) Biophysical analysis based on an effective model with a single equipotent progenitor pool provides a good fit to the clonal fate data for both the basal (red) and suprabasal (blue) clone size distribution at P7. The model prediction is illustrated by a line and shaded areas represent the 95% confidence interval. Data are means±S.D. (c,d) n=44 clones from a total of five mice, *=10-19 and **=20-39 basal cells. (e) Biophysical modelling predicts the indicated probabilities for either the symmetrical division of a progenitor (P, red) or differentiation (D, blue) every 1.5 days. (f) Strategy for cell cycle analysis using Col1a1-tetO-H2BmCherry mouse model following a 2-week doxycycline (DOX) pulse and chase starting at P2. (g, h) H2BmCherry (red) and Integrin A6 (ItgA6, white) detected in rendered confocal z stacks in back skin at indicated time points. Arrows indicate label-diluted areas lining the Integrin alpha 6+ basal layer. Images representative of 3 animals. (i) Intensity of fluorescence in the basal compartment of individual SGs at indicated time points. Line represents fluorescent decay rate as predicted in (e). Lines indicate the medians. Demarcated lines represent the boundary between dermis and epidermis at the prospective or adult SG. n=3 animals per group with 17-26 glands counted per animal. (j) Detection of K14 (red) and Scd1 (green) in the upper hair follicle at P2. Images representative of 3 experiments. (k) Number of Scd1- cells surrounding Scd1+ cells. Data are means±S.E.M (n=12 SGs in 3 animals). (l) Experimental gland size distribution (number of basal cells, dots), and prediction (thick line) based on the independent behaviour of 11 SG precursors following the stochastic rules of panel (e) (n=44 clones in 5 mice. Data in graphs displayed as mean±S.E.M. Nuclei are counterstained with DAPI (blue). Scale bars, 50μm.

