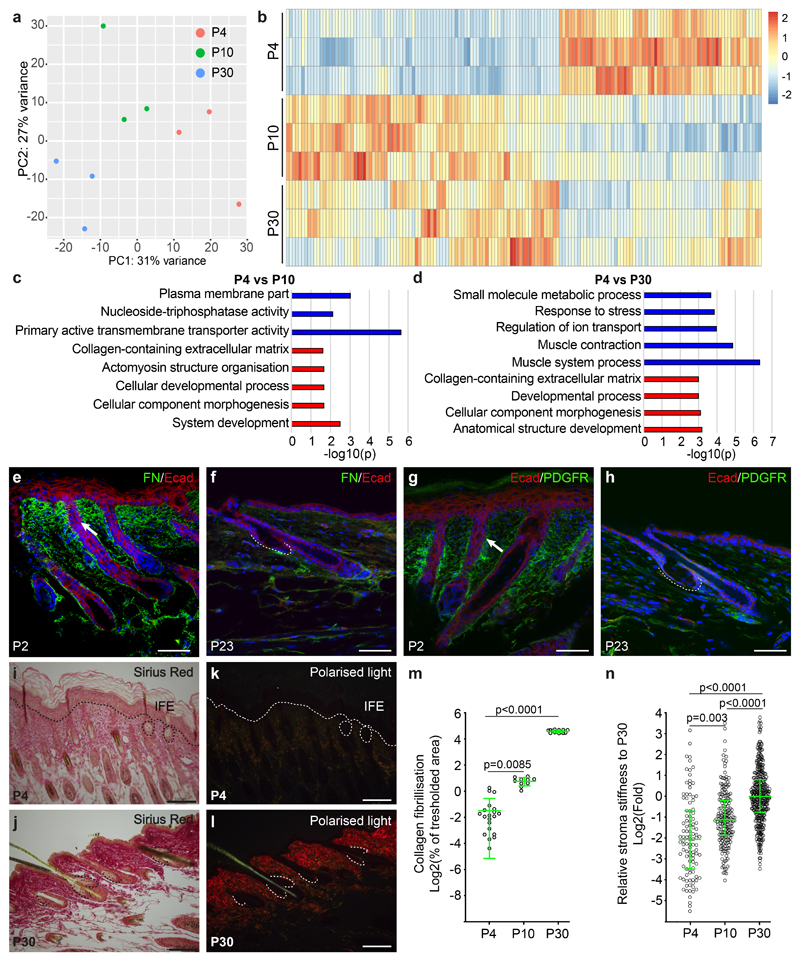
Figure 4. Dynamic extracellular matrix remodelling and sebaceous gland development.
(a) Principal component analysis of RNA-seq samples from morphogenesis and homeostasis. (b) Heatmap of differentially expressed genes (Log2fold change > 0.5; FDR < 0.05 based on Benjamini-Hochberg multiple correction method following a Wald test for statistical significance), comparing the expression profile of epithelial SG progenitors isolated from P4 to that of P10 and P30. (c-d) GO-term enrichment analysis highlighting the biological processes enriched in the P4 samples compared to P10 and P30 time points. (a-d) The overrepresentation test was performed using a Benjamini-Hochberg False Discovery Rate for multiple correction following a Fisher exact test for statistical significance. (e, f) Detection of fibronectin and (g, h) PDGFRa during morphogenesis (P2) and homeostasis (P23). (i-l) Sirius red staining of back skin sections for collagen deposition in brightfield (i, j) and fibrillisation visualized using polarized light (k, l) during morphogenesis and homeostasis (a-l) 3 mice were analysed for each time point. (m) Quantification of progressive fibrillisation at the indicated time points using the thresholded area method in ImageJ software on histological Sirius red stained sections (P4: n=21, P10: n=10, P30: n=14 individual measurements pooled from 3 animals per timepoint. Axis indicates the percentage of a given area positive for fibrillar collagen visualized in polarized contrast illumination. Data displayed as a scattered dot plot with line indicating means±S.D. (n) Atomic force microscopy measurement of stroma Elastic modulus in areas surrounding the SG using a spherical probe at time points indicated shown as fold change when compared to P30. Data displayed as a scattered dot plot with line indicating median with interquartile range. Number of individual measurements P4: n=103, P10: n=115, P30: n=395 pooled from 3 individual mice per timepoint. (m, n) Significance was estimated based on a Kruskal-Wallis test. Nuclei are counterstained with DAPI (blue). Scale bars are 100 μm.

