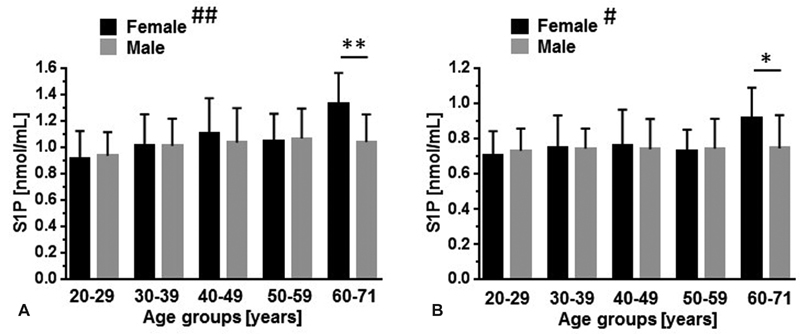
Fig. 2.

Influence of age and gender on circulatory S1P concentrations. S1P was measured in serum ( A ) and plasma ( B ) in a blood donor study group ( N = 174). Data (mean ± SD) were stratified for age and gender ( F, female = black bars, M, male = gray bars ). 20 to 29 years: n = 15 (F), n = 16 (M); 30 to 39 years: n = 15 (F), n = 20 (M); 40 to 49 years: n = 10 (F), n = 22 (M); 50 to 59 years: n = 18 (F). n = 31 (M); 60 to 71 years: n = 10 (F), n = 17 (M). # p < 0.05 (Kruskal–Wallis test, plasma [all female groups]); ## p < 0.01 (Kruskal–Wallis test, serum [all female groups]). No significant differences were detected for male groups. * p < 0.05, ** p < 0.01 (Mann–Whitney test). SD, standard deviation.
