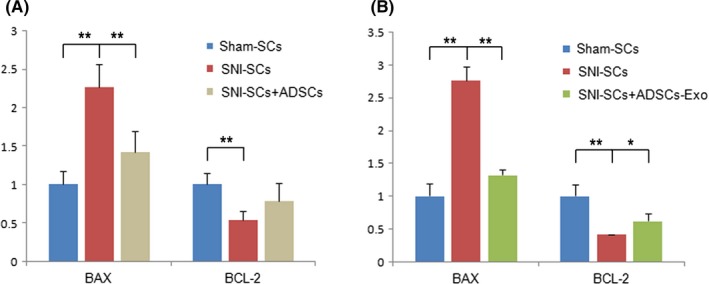
Figure 4.

Downregulation of Bax expression and upregulation of Bcl‐2 expression in SNI‐SCs. A, qPCR analysis showed significantly downregulated expression of Bax and significantly upregulated expression of Bcl‐2 with ADSC treatment. B, qPCR analysis showed significantly downregulated expression of Bax and significantly upregulated expression of Bcl‐2 with ADSC‐Exo treatment. Data represent the mean ± SD values. **P < 0.01, *P < 0.05, one‐way ANOVA
