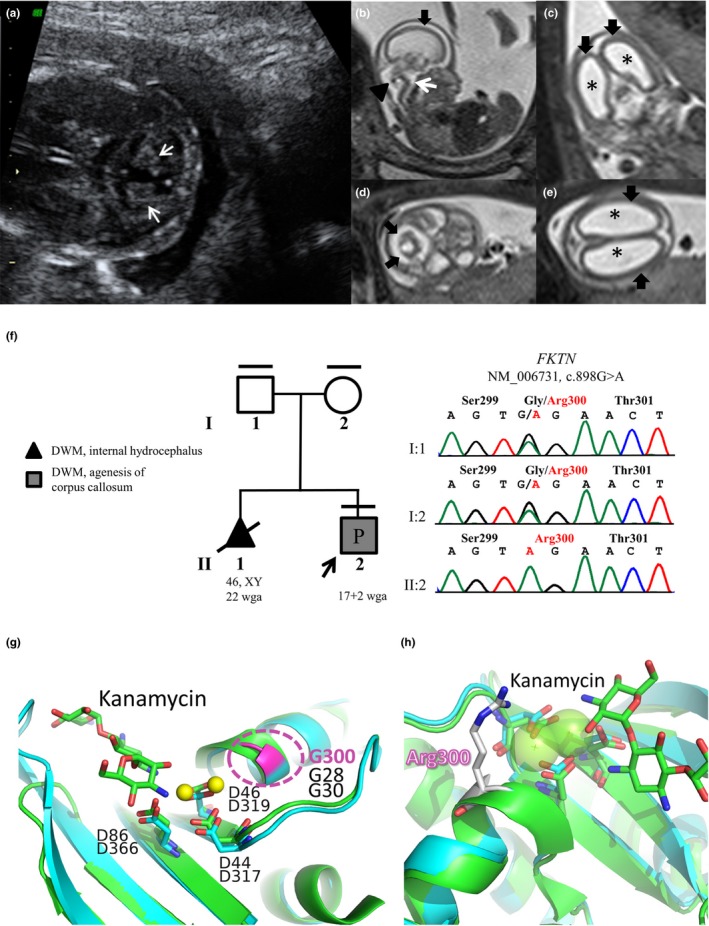
Figure 1.

(a) II:2 US imaging (17 + 1 wga). Cerebellar hypoplasia with cerebellar lobes diastasis (white arrows) is visible. (b–e) II:2 Fetal magnetic resonance imaging (18 wga). T2‐weighted images in sagittal (b), coronal (c), and transversal (d, e) planes. The T2 sagittal image (b) shows hypoplasia of the cerebellar vermis (arrowhead) associated with a “Z shaped” brainstem (white arrow) and lissencephaly (black arrow). Coronal and axial planes (c, e) show marked ventriculomegaly (*) and lissencephaly (black arrows). Hypoplasia of the cerebellar hemispheres is visible on transversal plane (d, black arrows). (f) Pedigree of the family and fukutin gene (FKTN) chromatograms of the fetus (II:2) and parents (I:1 and I:2). Black lines at the top indicates available DNAs. Black arrow indicates the fetus who underwent WES (II:2, pregnancy [P]). Clinical diagnoses of both fetuses are shown. Sanger analysis confirmed the presence of the homozygous FKTN mutation (chr9:108377676‐108377676 [GRCh37/hg19]; NM_006731.2: c.898G>A; NP_006722.2: p.Gly300Arg) in the proband and demonstrated the carrier status of both parents. (g, h) Structural modeling of FKTN variant. (g) Comparison between the homology modeled hFKTN (residues 278‐411; cyan) and one of its structural templates (4WQL, green). The two Mg2+ ions are displayed as yellow spheres. Conserved Asp residues in model and X‐ray structure coordinating the ions are shown as sticks and labeled. The aminoglycoside Kanamycin is also shown as green sticks. The position of Gly300 is shown in pink. (h) Detailed view of the active site cleft with modeled the putative position of Arg300
