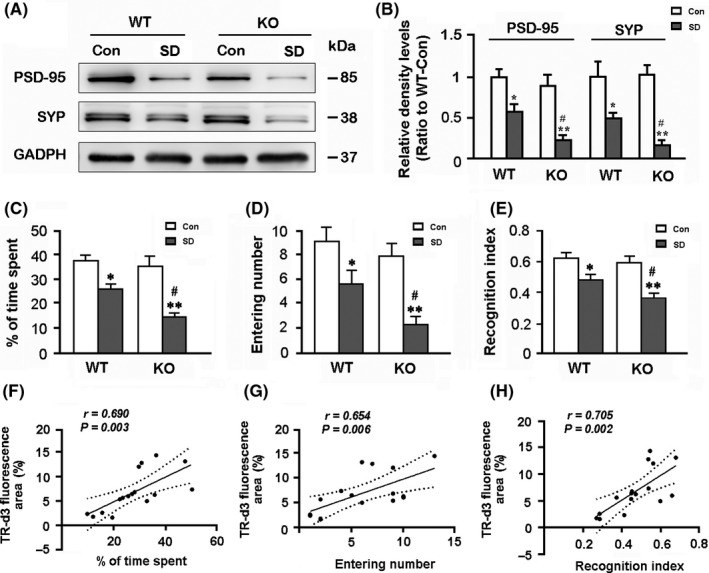
Figure 6.

Analysis of synaptic protein expression in the hippocampus, short‐term working memory, and correlation between glymphatic transport and memory‐related parameters. A, B, Representative bands of Western blot and densitometry analysis of PSD‐95 and SYP protein levels in the hippocampal samples. C, The percentage of time spent in the novel arm during the Y‐maze test. D, The number of entries into the novel arm. E, The recognition index (Novel object/Novel object + Familiar object) in the NORT. F‐H, Percentage of cerebrospinal fluid tracer influx into the brain parenchyma partially correlated with short‐term working memory relate indexes including percentage of time spent in the novel arm of the Y‐maze, times of entering into the novel arm, and recognition index of NORT. Data represent mean ± SEM from four mice per group in (B) and 10 mice per group in (C‐E), and analyzed by the two‐way ANOVA with Tukey's post hoc test. *P < .05, **P < .01, SD vs Con; # P < .05, ## P < .01, AQP4 KO vs WT. Data in (F‐H) from four mice per group were analyzed by Pearson correlation analysis. AQP4, aquaporin 4; KO, knockout; SD, sleep disruption; WT, wild‐type
