Figure 3.

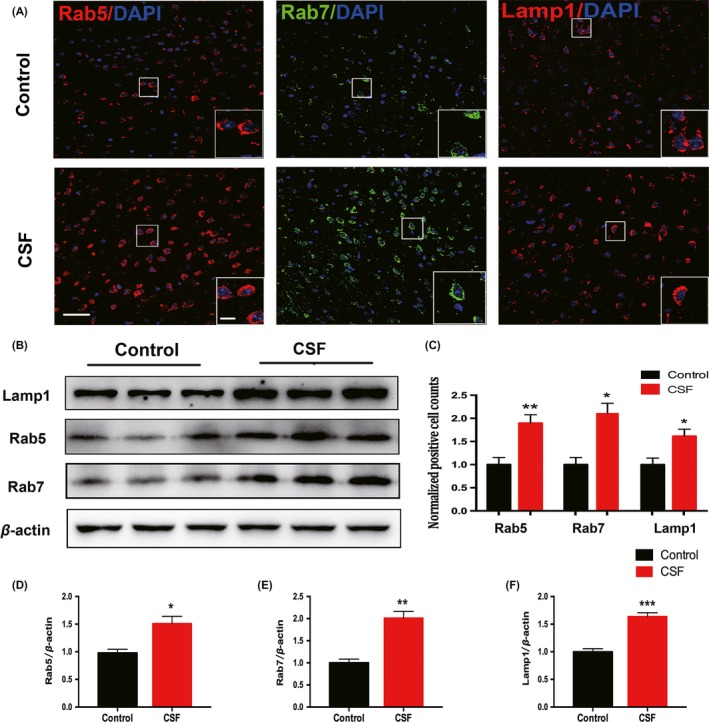
Intracellular endosomes and lysosomes in the cortex were dysregulated after CSF. A, Representative confocal images of coronal sections labeled by Rab5, Rab7, and Lamp1 staining in the cortex of CSF and control mice. Scale bar = 40 μm. Local enlarged images were presented in the white squares. Scale bar = 10 μm. B, Representative Western blots showing the changes in the expression of Rab5, Rab7, and Lamp1 in the cortex of CSF and control mice. C, Histograms showed the quantitative density of cells immunoreactive for Rab5, Rab7, and Lamp1. n = 5 per group, *P < .05, **P < .01. D‐F, Quantitative analysis of the Rab5, Rab7, and Lamp1 protein levels was performed. Protein expression levels were normalized to the level of β‐actin. n = 5 per group, *P < .05, **P < .01, ***P < .001
