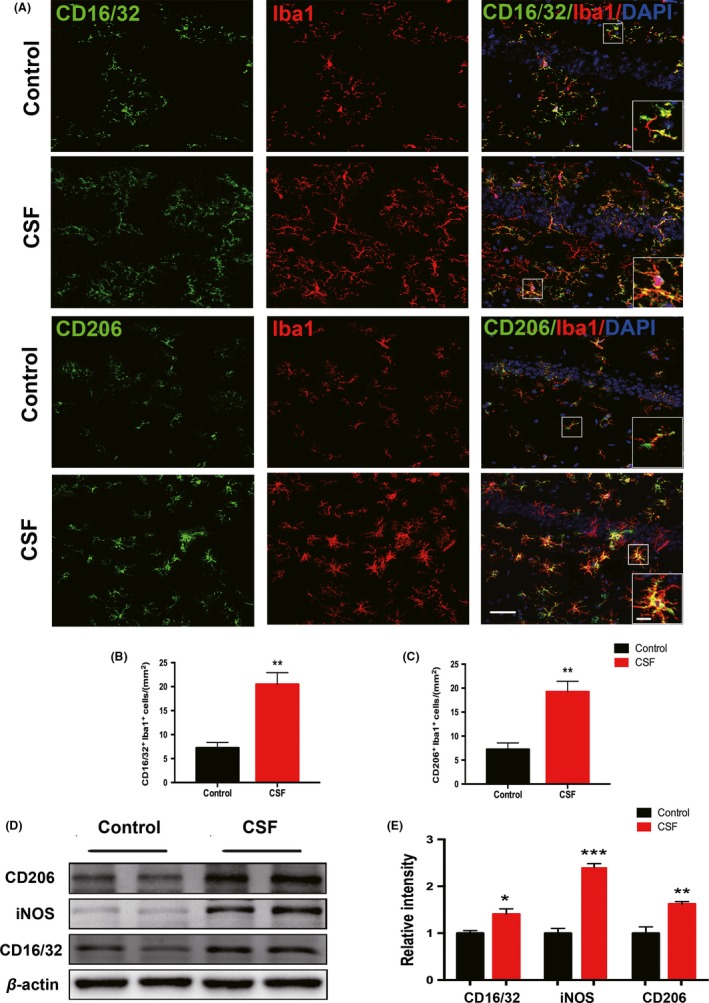
Figure 7.

M1 and M2 polarized microglia in the hippocampus were activated after CSF. A, The M1 phenotype of microglia was detected by double staining for CD16/32 (green) and Iba1 (red), while the M2 phenotype was detected by double staining for CD206 (green) and Iba1 (red) in the hippocampus of CSF and control mice. Scale bar = 40 μm. Local enlarged images were presented in the white squares. Scale bar = 10 μm. B‐C, Quantitative analysis of Iba1+CD16/32+ double‐positive cells and Iba1+CD206+ double‐positive cells was shown in the histogram. n = 5 per group, **P < .01. D, Representative Western blots of CD16/32, iNOS, and CD206 in the hippocampus of CSF and control mice. E, Statistical analysis of Western blots of CD16/32, iNOS, and CD206 in the CSF and control groups. Protein expression levels were normalized to the level of β‐actin. n = 5 per group, *P < .05, **P < .01, ***P < .001
