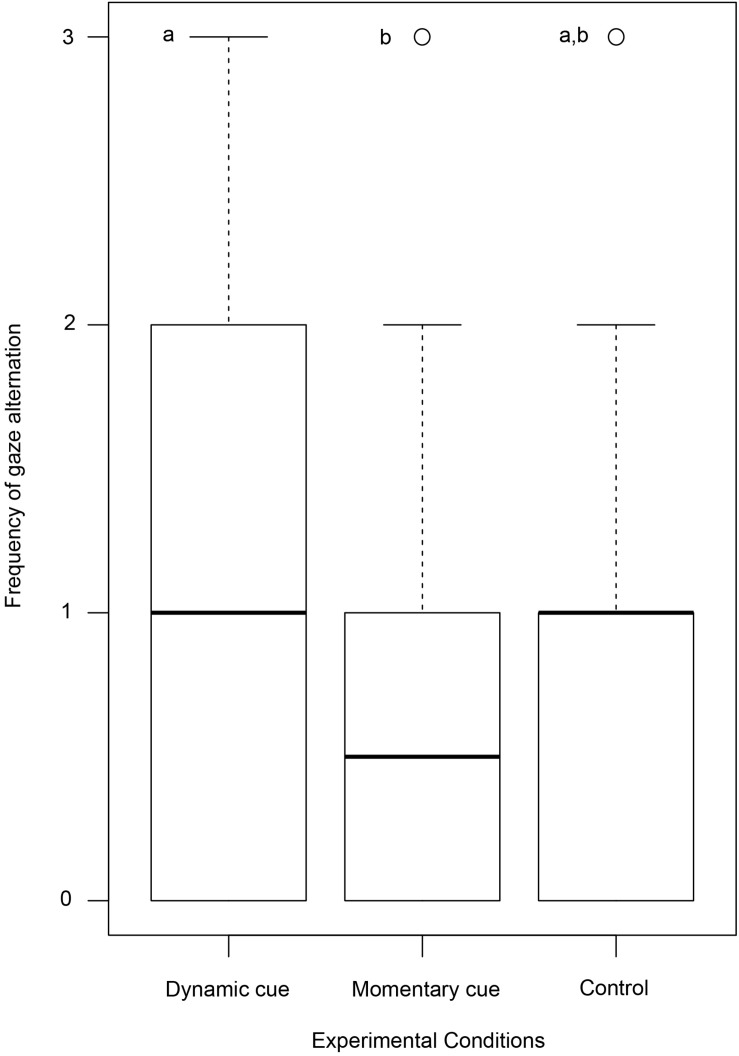
FIGURE 2.
Box and Whisker plot showing the frequency of gaze alternation by dogs. Boxes represent the interquartile range, horizontal bars within boxes indicate median values, and whiskers represent the upper range of the data. Different letters indicate significant differences between the experimental conditions.

