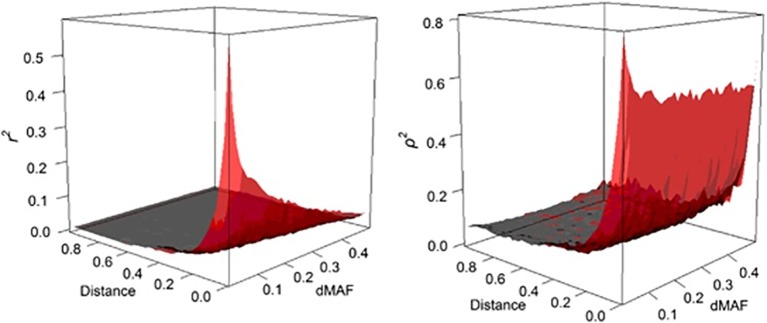
Figure 2.
The behavior of LD as a function of inter-marker distance (Mb) and MAF interval (dMAF). The estimates of r 2 (left panel) and ρ 2 (right panel) are depicted as surface plots for SNP loci on chromosome 3 of the Italian Tuscan population in HapMap III (from Gianola et al., 2013).

