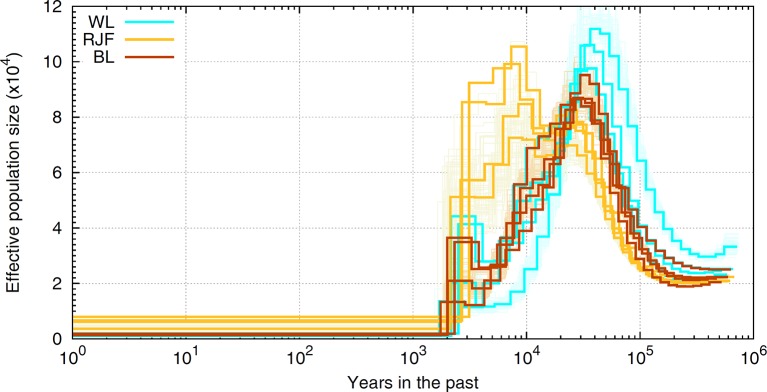
Figure 6.
A schematic illustration of historical Ne in chicken. The ancestral demography is inferred in sequence resolution for RJF and white (WL) and brown (BL) layers employing the Pairwise Sequentially Markovian Coalescent [PSMC, Li and Durbin (2011)] framework. The scale on the x-axis is years in the past and the scale on the y-axis represents the historical effective population numbers. Orange (RJF), brown (BL), and cyan (WL) lines represent inferred demography for different populations with bootstraps in lighter colors. Note that inferences of bootstraps are depicted only for one sample of each population.

