


Figure 5.
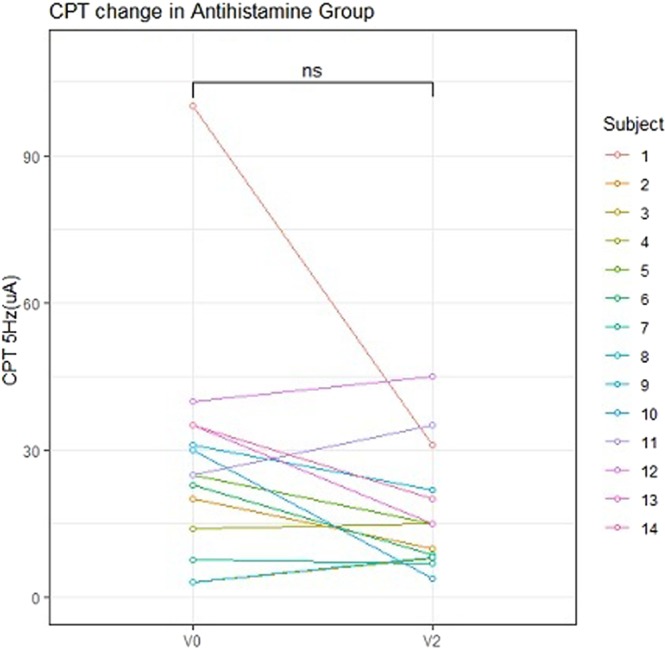
Changes in the CPT at 5 and 250 Hz with time in the Antihistamine group. CPT, electric current perception threshold; Lt, left; Rt, right; V0, baseline; V2, after treatment with two types of antihistamines; ns, not significant.
Official websites use .gov
A
.gov website belongs to an official
government organization in the United States.
Secure .gov websites use HTTPS
A lock (
) or https:// means you've safely
connected to the .gov website. Share sensitive
information only on official, secure websites.
Changes in the CPT at 5 and 250 Hz with time in the Antihistamine group. CPT, electric current perception threshold; Lt, left; Rt, right; V0, baseline; V2, after treatment with two types of antihistamines; ns, not significant.