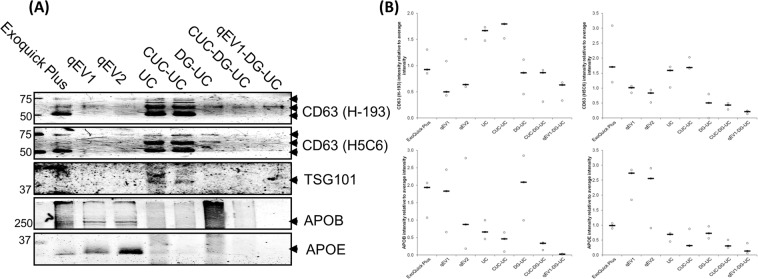
Figure 6.
Western blot analysis of EV markers, CD63 and TSG101, and lipoprotein markers, APOB, and APOE. (A) 4 µg of vesicular protein isolated from 200 µl human serum using each method alone or in combination were separated by SDS–PAGE and immunoblotted with anti-human CD63 (H-193 and H5C6), TSG101, APOE and APOB antibodies. Representative images are shown. (B) Graph: Densitometric quantitation of the distribution of CD63, TSG101, APOE and APOB protein expression in each method. Black lines represent medians. N = 3 isolations. Arbitrary Units (AU) = (signal intensity method)/Sum (signal intensity method1–8).

