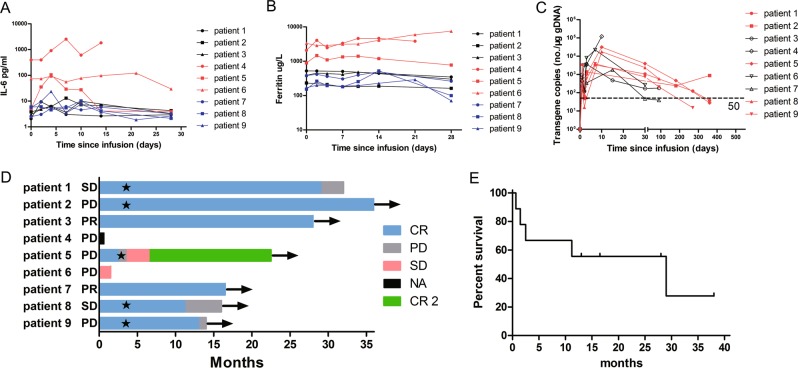
Fig. 1. Patients’ characteristics and survival after CD30 CAR-T cell infusion.
a The serum IL-6 level of each patient was assessed before and at serial time points after cell infusion; the red lines representing the three patients with higher tumor burden were much higher than the others. b The serum ferritin level of each patient was assessed before and at serial time points after cell infusion; the red lines representing the three patients with higher tumor burden were much higher than the others. c The copies of anti-CD30 CAR transgenes, the red lines representing the five patients who received anti-PD-1 antibody last longer; the horizontal line denotes the lower limit of quantitation (50 copies/μg). d Clinical responses for the nine patients. On the left of the Y axis is the disease status before infusion; arrows indicate alive; the star marker indicated the start time of anti-PD-1 antibody therapy. Patient #5 received autologous transplantation 4 months after PD, and achieved CR again (CR2). e Progression-free survival of all nine patients. NA not applicable, PD progression of disease, SD stable disease, PR partial response, CR complete response.

