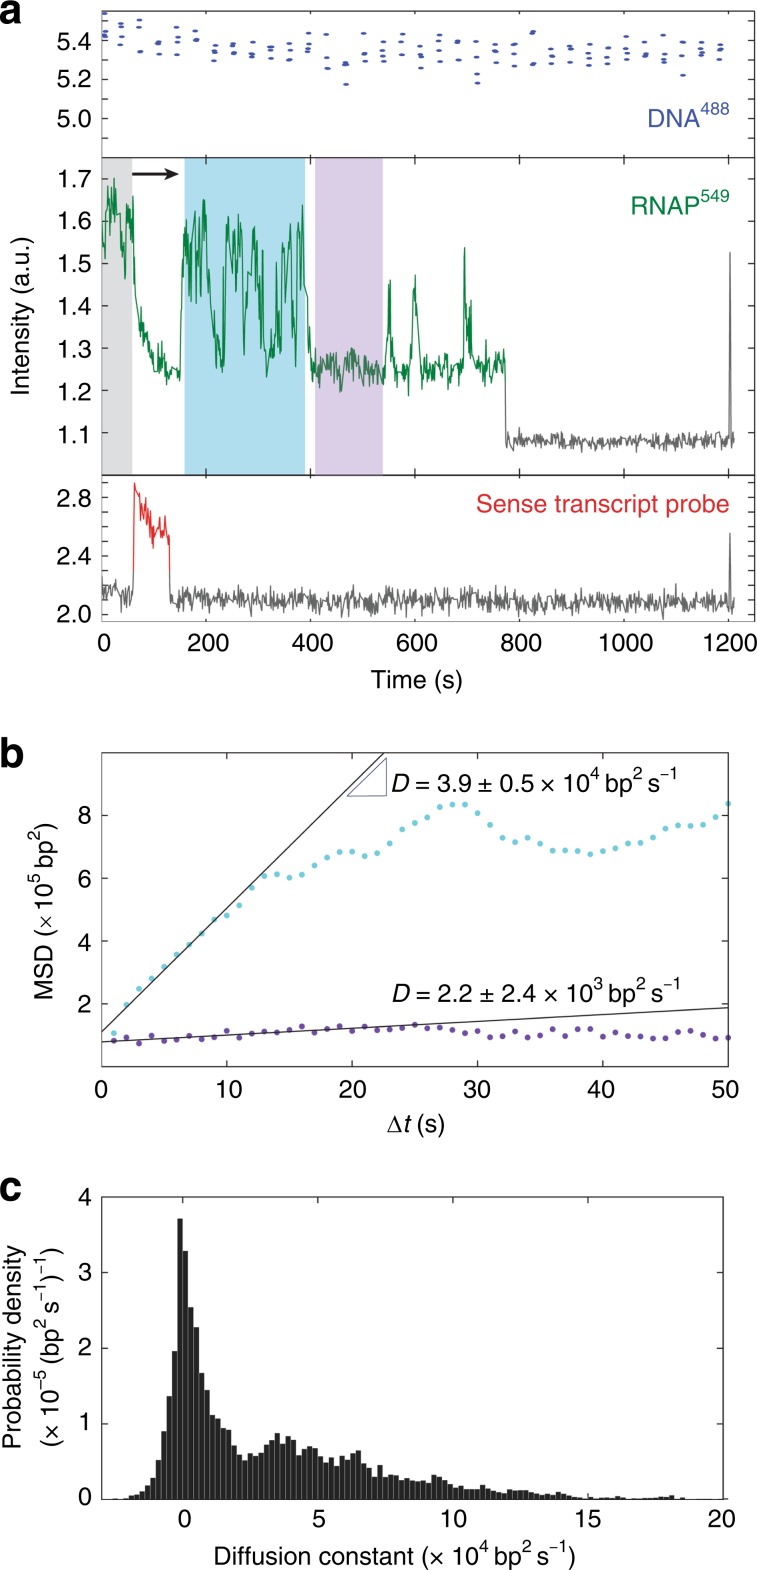
Fig. 2. RNAP can diffuse along DNA after termination.
a A single-molecule emission record, as in Fig. 1c, for a different DNA spot location. Gray, teal, and purple highlight time intervals of high RNAP549 fluorescence before detection of transcript probe and post-termination intervals of fluctuating and low fluorescence, respectively. b Mean squared displacement (MSD) of RNAP549 position on DNA during the teal and purple intervals in (a). Linear fits to the first ten points of each MSD curve yield the effective diffusion coefficients over 10 s intervals, D. c Normalized histogram of D values measured separately for every 50 s window in n = 41 recordings of RNAP549 retained on DNA after termination (13,522 windows total).

