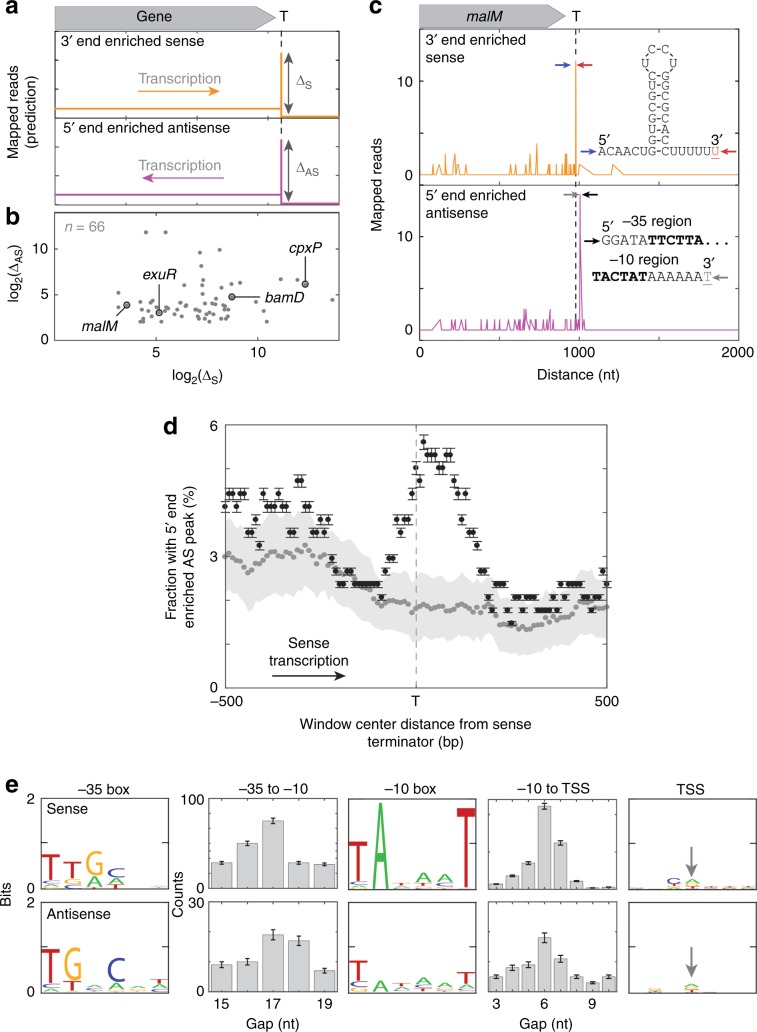
Fig. 5. Secondary initiation of antisense transcripts in vivo.
a Predicted Rend-seq signature of antisense secondary initiation at an intrinsic terminator. Idealized plot shows a genomic region near a terminator (T). Termination is indicated by a peak in 3′ end enriched sense reads (orange). The secondary initiation hypothesis predicts nearby 5′ end enriched antisense reads (magenta), suggestive of antisense secondary initiation. ΔS and ΔAS are the relative amounts of sense termination and antisense initiation at particular genomic positions as estimated by the peak heights. b Peak heights from 66 (of 339 total) terminators detected in E. coli that show a substantial ΔAS peak within 500 bp of the terminator ΔS peak. Labels mark the genes shown in (c) and in Supplementary Fig. 6A. c Example of the phenomenon predicted in (a) observed in Rend-seq data from ref. 39 near the terminator of the E. coli malM gene. Shown are the factor-independent terminator RNA sequence with the peak of sense termination at the underlined red nucleotide, and the promoter-like non-template strand DNA sequence with the peak of antisense initiation at the underlined gray nucleotide. Arrows mark the positions of the displayed sequences in the Rend-seq data. d Antisense initiation peak frequency correlates with positions of sense terminators in the E. coli genome. Pooled data from 339 terminators between genes transcribed in the same direction (see Methods). Plot shows the fraction (±s.e.m.) of 200 nt-wide windows centered at the indicated distance upstream or downstream from the terminators that exhibit a peak of antisense initiation with z-score > 12 (black). Also shown is the mean ± s.d. of negative controls (gray) in which the same analysis was repeated 100 times each using 339 randomly selected locations in the E. coli genome that lack apparent terminators. These locations were restricted to those >700 nt from an annotated terminator and were on the sense strand of genomic regions containing at least three consecutive genes in the same orientation. In 100% of these 100 control replicates, the fraction at the terminator location with a 5′ end AS peak was <3.9%, indicating that the difference between experimental data and controls was significant (p < 0.01). In this analysis, we used a smaller window size than in (b) to improve spatial resolution and a very stringent peak height criterion, z > 12. This leads to detection of only the strongest peaks and shows that these strong antisense peaks are preferentially found in a region ± 200 nt from sense terminators. e Sequence characteristics (illustrated as in ref. 62) for n = 250 strong sense promoters (top) and for the n = 66 terminator-proximal antisense initiation sites shown in (b) (bottom), all detected by Rend-seq39. Logos show the sequence motifs for the −35 box, −10 box, and transcription start site (TSS, arrow); histograms display the distributions of spacings between these elements. When the size of the −10 box was expanded from six to 8, 9, or 10 bp, there was no strong evidence for extended −10 sequences.

