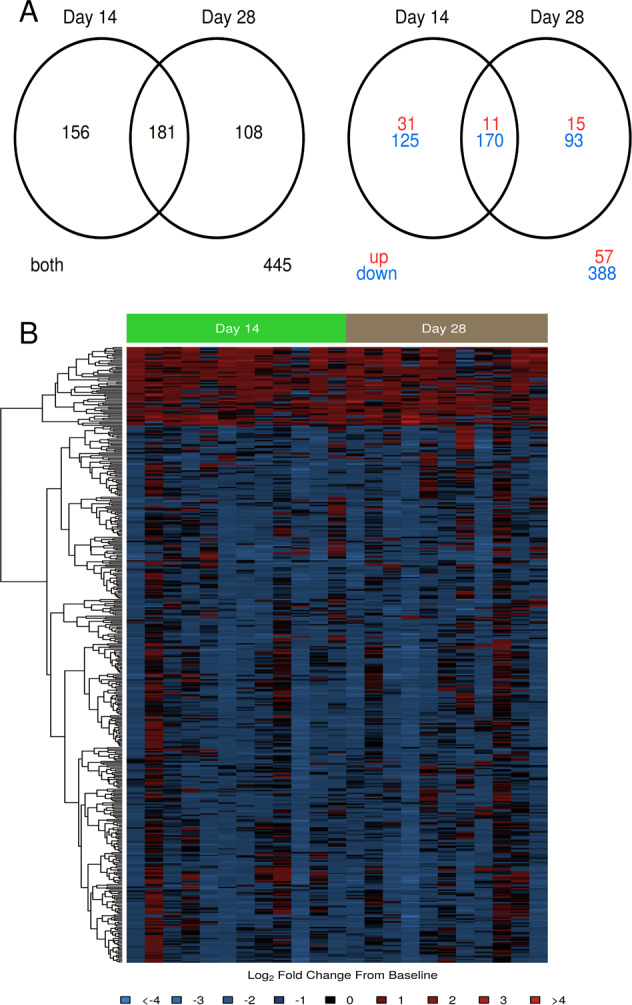
Fig. 3. Gene expression signatures following F1/V vaccine that showed statistically differential responses compared to pre-vaccination were primarily downregulated.

a Venn digrams summarizing overlap in DE genes between days 14 and 28 post-second vaccination. The first shows total differentially expressed genes and the second part shows the number of upregulated and downregulated genes separately. b Heatmap of log2 fold change from pre-vaccination. Rows represent DE genes, columns represent samples. In red: upregulated compared to pre-vaccination; in blue: downregulated compared to pre-vaccination. Dendrograms were obtained using complete linkage clustering of uncentered pairwise Pearson correlation distances between log2 fold changes.
