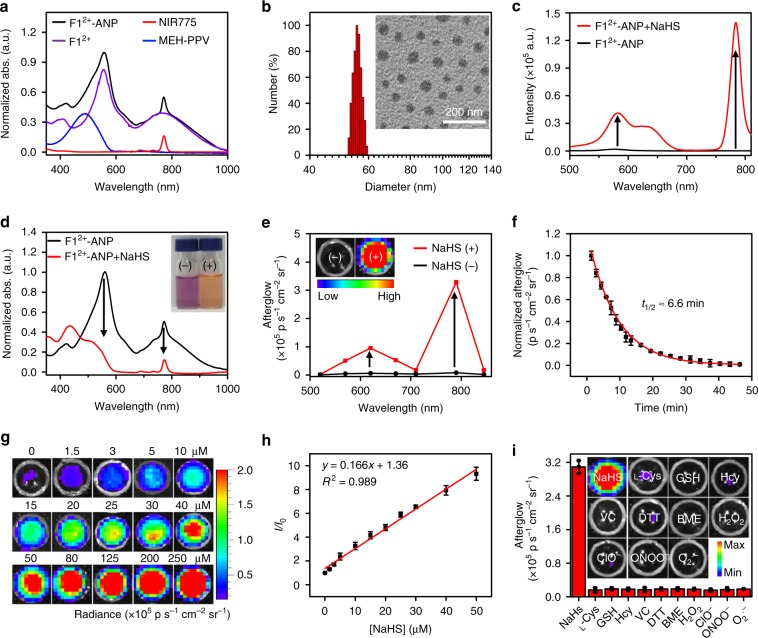
Fig. 2. Characterization of F12+-ANP in vitro.
a Comparison of the UV–visible-NIR absorption spectra of F12+-ANP, F12+, NIR775, and MEH-PPV. b DLS and transmission electron microscopy (TEM) image (inset) of F12+-ANP. c Fluorescence and d absorption spectra of F12+-ANP (58/28/2.2 μg mL−1 F12+(BF4−)2/MEH-PPV/NIR775) in the absence or presence of NaHS (200 μM, 1 min). Inset: photographs of F12+-ANP before (−) and after (+) incubation with NaHS in PBS buffer. Fluorescence spectra was acquired by synchronous fluorescence scanning (λex = 400‒800 nm, offset = 100 nm). e Afterglow luminescence spectra and images (inset) of F12+-ANP (58/28/2.2 μg mL−1 F12+(BF4−)2/MEH-PPV/NIR775) with and without incubation with NaHS (200 μM) in PBS buffer (pH 7.4) at 37 °C for 1 min, followed by irradiation with 808-nm laser (1 W cm−2, 1 min). After cessation of laser, the afterglow images were acquired under an open filter, with an acquisition time of 60 s. f Decay of afterglow luminescence of H2S-activated F12+-ANP in PBS buffer at 37 °C. g Afterglow luminescence images of F12+-ANP (58/28/2.2 μg mL−1 F12+(BF4−)2/MEH-PPV/NIR775) upon incubation with varying concentrations of NaHS (0, 1.5, 3, 5, 10, 15, 20, 25, 30, 40, 50, 80, 125, 200, and 250 μM) at 37 °C for 1 min. h Plot of the afterglow luminescence intensity of F12+-ANP and the concentration of NaHS from 0 to 50 μM. i Afterglow luminescence intensities and images (inset) of F12+-ANP upon incubation with different reductants or ROS (200 µM NaHS, 1.25 mM l-cysteine (l-Cys), 10 mM glutathione (GSH), 1 mM homocysteine (Hcy), 1.25 mM ascorbic acid (VC), 1.25 mM dithiothreitol (DTT), 100 μM β-mercaptoethanol (BME), 1 mM H2O2, 1 mM ClO−, ONOO− (1 mM NaNO2 + 1 mM H2O2), O2.− (100 μM xanthine + 22 mU xanthine oxidase)) for 10 min. The solutions were then irradiated with the 808-nm laser (1 W cm−2, 1 min), and the NIR afterglow images were collected for 60 s with a 790 nm filter after the end of irradiation. Data denote mean ± standard deviation (s.d.) (n = 3). Source data are provided as a Source Data file.

