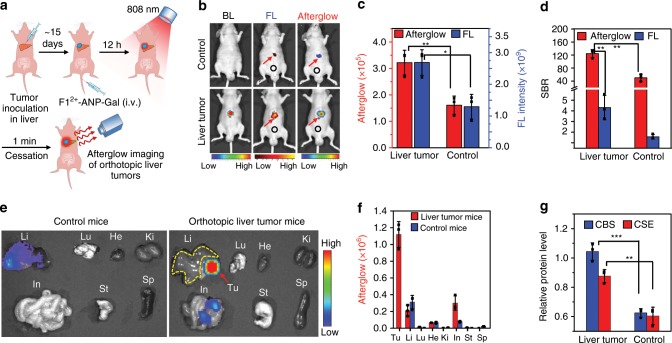
Fig. 5. Noninvasive imaging of orthotopic liver tumors in mice.
a Schematic for afterglow imaging of orthotopic HepG2 tumors in living mice. b Bioluminescence (BL), fluorescence (FL), and afterglow imaging of control mice (Control) and orthotopic HepG2 tumor (liver tumor) bearing mice at 12 h post i.v. injection of F12+-ANP-Gal (211/100/8 μg F12+(BF4−)2/MEH-PPV/NIR775, 200 μL). c Afterglow (red) and FL (blue) intensities in the livers of control mice and orthotopic liver tumor-bearing mice. d Comparison of the SBRs for afterglow and fluorescence imaging of livers in control mice and orthotopic liver tumor-bearing mice. Red arrows indicate the locations of livers, and black circles indicate the background locations. e Representative ex vivo afterglow images of main organs (e.g., liver (Li), lung (Lu), heart (He), kidneys (Ki), intestines (In), stomach (St), spleen (Sp), and tumor (Tu)) resected from control mice (left) and orthotopic HepG2 tumor-bearing mice (right) at 12 h post i.v. injection of F12+-ANP-Gal. Red arrow and yellow dash box indicate the locations of HepG2 tumor in the liver and normal liver tissues chosen for region of interest (ROI), respectively. f Comparison of the average afterglow intensities of tumors and main organs resected from control (blue) and orthotopic liver tumor (red) mice. g WB analysis shows the relative CBS and CSE protein levels in the liver tissues resected from control mice and HepG2 tumor tissues resected from orthotopic liver tumor mice. All afterglow luminescence images were acquired for 60 s with an open filter, after pre-irradiation of mouse body or organs with the 808-nm laser (1 W cm−2, 1 min). All fluorescence images were acquired with λex/em = 740/790 nm. Data denote mean ± s.d. (*P < 0.05, **P < 0.01, n = 3). Statistical differences were analyzed by Student’s t test. Source data are provided as a Source Data file.

