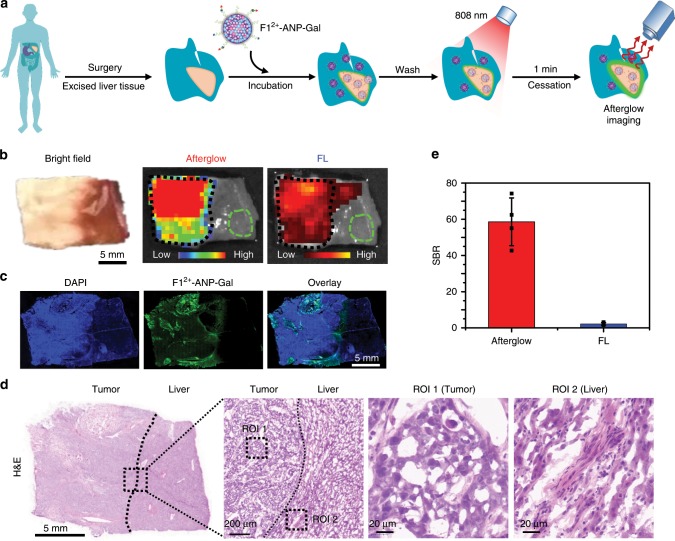
Fig. 7. Afterglow imaging of liver tumor tissues in HCC specimens.
a Schematic for afterglow imaging of tumor tissues in clinically excised liver specimens using F12+-ANP-Gal. b Representative photograph (bright field), afterglow, and FL images of the liver specimen resected from an HCC patient. The specimen was incubated with F12+-ANP-Gal (58/28/2.2 μg mL−1 F12+(BF4−)2/MEH-PPV/NIR775) in PBS buffer (1×, pH 7.4) at 37 °C for 3 h, and then rinsed with PBS buffer for three times. The whole specimen was irradiated with the 808-nm laser (1 W cm−2, 1 min). After cessation of the laser, the afterglow image was acquired under an open filter, with an acquisition time of 60 s. The fluorescence image was collected with λex/em = 740/790 nm. c Fluorescence images of liver tissue slices were dissected from the HCC specimen after incubation with F12+-ANP-Gal (green) for 3 h and stained with DAPI (blue). d H&E staining of the liver tissue slice dissected from the HCC specimen. Black dash boxes indicate the enlarged areas, in which box ROI 1 shows the tumor tissue and box ROI 2 indicates the normal liver tissue, respectively. e Quantitative analysis of the average SBRs for afterglow and fluorescence imaging of liver specimens resected from HCC patients. Data denote mean ± s.d. (n = 4). Black dash boxes in b indicate the location of tumors, and green dash boxes indicate the location of normal liver tissues selected as the background. Source data are provided as a Source Data file.

