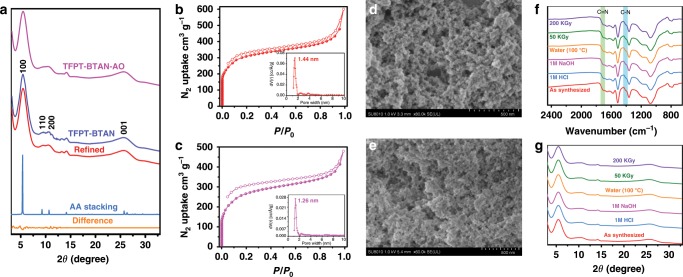
Fig. 2. Characterization of TFPT-BTAN and TFPT-BTAN-AO.
a PXRD profiles. Nitrogen adsorption–desorption isotherms of b TFPT-BTAN and c TFPT-BTAN-AO. Insets: the pore-size distributions calculated from non-local density functional theory. SEM images of d TFPT-BTAN and e TFPT-BTAN-AO. f FT-IR spectra and g PXRD profiles of TFPT-BTAN-AO before and after treatment with water (100 °C), HCl (1 M), NaOH (1 M), and γ-ray irradiation (50 kGy, 200 kGy).

