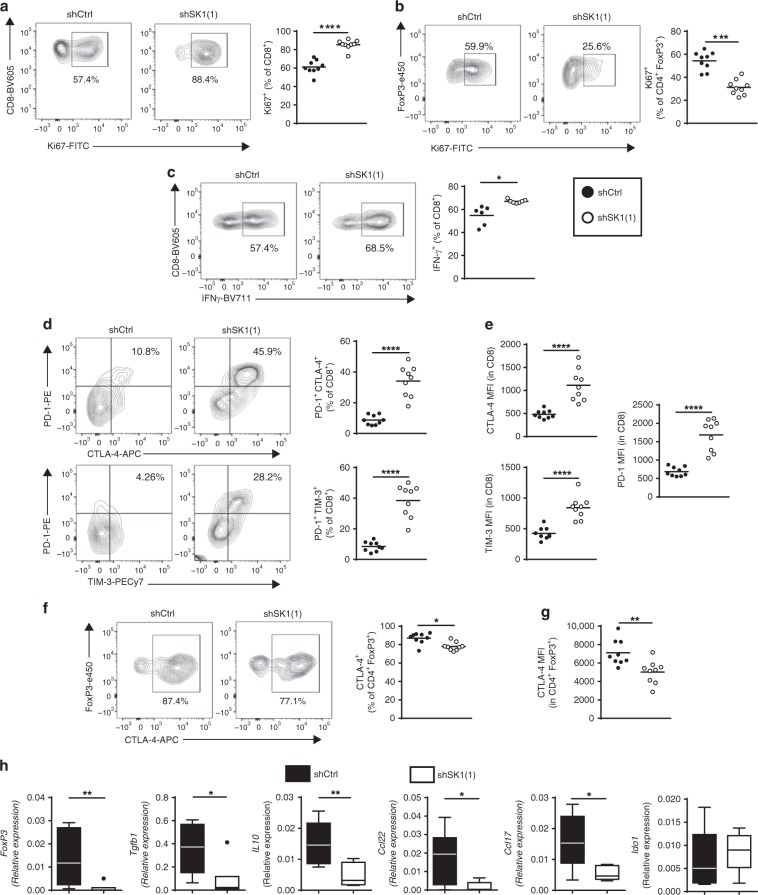
Fig. 3. SK1 silencing reduces Treg accumulation in tumors.
Control shRNA (shCtrl; black points) or SK1-targeted shRNA (shSK1(1); white points) Yumm melanoma cells were injected intradermally in C57BL/6 mice, and TIL content was analyzed by flow cytometry on day 11 (n = 9 mice/group). Percentages (%) of CD8 + T cells (a) and Treg cells (b) expressing Ki67. c Proportion of IFNγ + CD8 cells after PMA and Ionomycin stimulation. d Percentage of PD-1 + CTLA-4 + (upper panel) and PD-1 + TIM-3 + (lower panel) cells. e MFI of CTLA-4, PD-1 and TIM-3 among CD8 + TILs. Percentage (f) and Mean Fluorescence Intensity (MFI; g) of CTLA-4 in Treg. Each symbol represents an independent tumor (n = 9). h Levels of Foxp3, Tgfb1, Il10, Ccl17, Ccl22 and Ido1 transcripts in shCtrl (black boxes) or shSK1(1) (white boxes) tumors were quantified by RT-qPCR. The bottom-most and topmost horizontal lines, the lower and upper hinges, and the middle line of the boxplots indicate the minimum and maximum values, the 25th and 75th percentiles, and the median, respectively. Results are representative of two independent experiments (n = 8 mice/group). Samples were compared using Mann–Whitney test.

